Bifidobacterium vespertilionis
Taxonomy: cellular organisms; Bacteria; Terrabacteria group; Actinobacteria; Actinomycetia; Bifidobacteriales; Bifidobacteriaceae;
Average proteome isoelectric point is 6.08
Get precalculated fractions of proteins
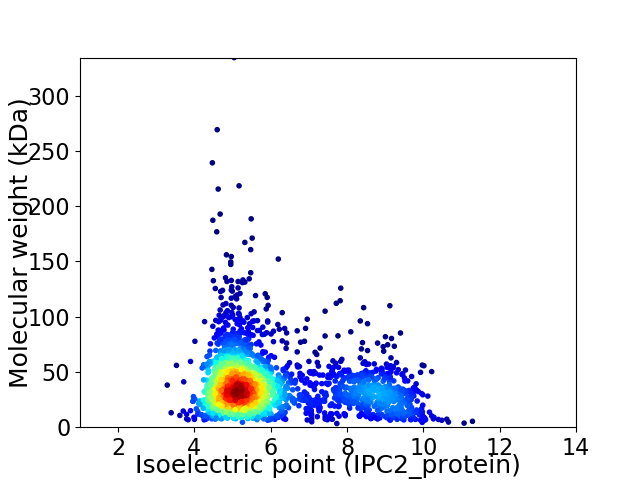
Virtual 2D-PAGE plot for 2281 proteins (isoelectric point calculated using IPC2_protein)
Get csv file with sequences according to given criteria:
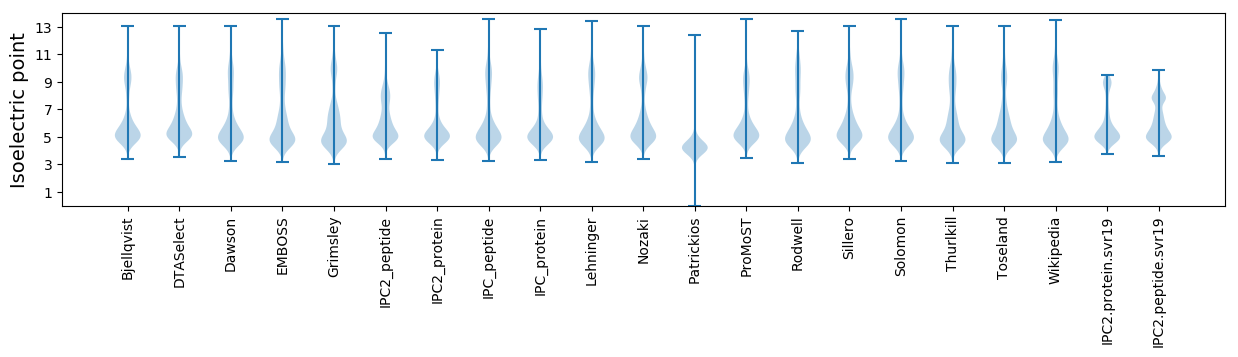
* You can choose from 21 different methods for calculating isoelectric point
Summary statistics related to proteome-wise predictions
Protein with the lowest isoelectric point:
>tr|A0A5J5DU38|A0A5J5DU38_9BIFI DUF58 domain-containing protein OS=Bifidobacterium vespertilionis OX=2562524 GN=EM848_06660 PE=4 SV=1
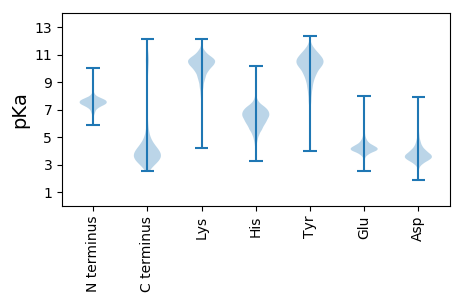
MM1 pKa = 7.77SDD3 pKa = 4.27FEE5 pKa = 4.47PFYY8 pKa = 11.06DD9 pKa = 4.4VNRR12 pKa = 11.84TYY14 pKa = 11.52DD15 pKa = 3.53DD16 pKa = 4.03NYY18 pKa = 11.15ADD20 pKa = 4.03GPFGAFAQALKK31 pKa = 10.8AGDD34 pKa = 3.81AAGSPAAGSPAEE46 pKa = 4.33SAAVPAGVAGSPASGSPATDD66 pKa = 3.31VPAGAASTPHH76 pKa = 5.6VPP78 pKa = 4.21
MM1 pKa = 7.77SDD3 pKa = 4.27FEE5 pKa = 4.47PFYY8 pKa = 11.06DD9 pKa = 4.4VNRR12 pKa = 11.84TYY14 pKa = 11.52DD15 pKa = 3.53DD16 pKa = 4.03NYY18 pKa = 11.15ADD20 pKa = 4.03GPFGAFAQALKK31 pKa = 10.8AGDD34 pKa = 3.81AAGSPAAGSPAEE46 pKa = 4.33SAAVPAGVAGSPASGSPATDD66 pKa = 3.31VPAGAASTPHH76 pKa = 5.6VPP78 pKa = 4.21
Molecular weight: 7.51 kDa
Isoelectric point according different methods:
Protein with the highest isoelectric point:
>tr|A0A5J5E1Z2|A0A5J5E1Z2_9BIFI Ketol-acid reductoisomerase (NADP(+)) OS=Bifidobacterium vespertilionis OX=2562524 GN=ilvC PE=3 SV=1
MM1 pKa = 7.44KK2 pKa = 9.6RR3 pKa = 11.84TFQPNNRR10 pKa = 11.84RR11 pKa = 11.84RR12 pKa = 11.84HH13 pKa = 4.83MKK15 pKa = 9.27HH16 pKa = 5.56GFRR19 pKa = 11.84VRR21 pKa = 11.84MRR23 pKa = 11.84TRR25 pKa = 11.84SGRR28 pKa = 11.84AVINARR34 pKa = 11.84RR35 pKa = 11.84NKK37 pKa = 9.32GRR39 pKa = 11.84KK40 pKa = 6.43TLSAA44 pKa = 4.15
MM1 pKa = 7.44KK2 pKa = 9.6RR3 pKa = 11.84TFQPNNRR10 pKa = 11.84RR11 pKa = 11.84RR12 pKa = 11.84HH13 pKa = 4.83MKK15 pKa = 9.27HH16 pKa = 5.56GFRR19 pKa = 11.84VRR21 pKa = 11.84MRR23 pKa = 11.84TRR25 pKa = 11.84SGRR28 pKa = 11.84AVINARR34 pKa = 11.84RR35 pKa = 11.84NKK37 pKa = 9.32GRR39 pKa = 11.84KK40 pKa = 6.43TLSAA44 pKa = 4.15
Molecular weight: 5.34 kDa
Isoelectric point according different methods:
Peptides (in silico digests for buttom-up proteomics)
Below you can find in silico digests of the whole proteome with Trypsin, Chymotrypsin, Trypsin+LysC, LysN, ArgC proteases suitable for different mass spec machines.| Try ESI |
 |
|---|
| ChTry ESI |
|
|---|
| ArgC ESI |
|
|---|
| LysN ESI |
|
|---|
| TryLysC ESI |
|
|---|
| Try MALDI |
|
|---|
| ChTry MALDI |
|
|---|
| ArgC MALDI |
|
|---|
| LysN MALDI |
|
|---|
| TryLysC MALDI |
|
|---|
| Try LTQ |
|
|---|
| ChTry LTQ |
|
|---|
| ArgC LTQ |
|
|---|
| LysN LTQ |
|
|---|
| TryLysC LTQ |
|
|---|
| Try MSlow |
|
|---|
| ChTry MSlow |
|
|---|
| ArgC MSlow |
|
|---|
| LysN MSlow |
|
|---|
| TryLysC MSlow |
|
|---|
| Try MShigh |
|
|---|
| ChTry MShigh |
|
|---|
| ArgC MShigh |
|
|---|
| LysN MShigh |
|
|---|
| TryLysC MShigh |
|
|---|
General Statistics
Number of major isoforms |
Number of additional isoforms |
Number of all proteins |
Number of amino acids |
Min. Seq. Length |
Max. Seq. Length |
Avg. Seq. Length |
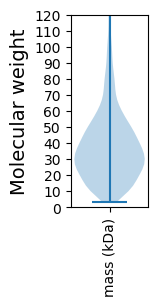
Avg. Mol. Weight |
|---|---|---|---|---|---|---|---|
0 |
834372 |
29 |
3152 |
365.8 |
39.79 |
Amino acid frequency
Ala |
Cys |
Asp |
Glu |
Phe |
Gly |
His |
Ile |
Lys |
Leu |
|---|---|---|---|---|---|---|---|---|---|
11.643 ± 0.066 | 0.919 ± 0.017 |
6.673 ± 0.054 | 5.425 ± 0.048 |
3.433 ± 0.035 | 8.381 ± 0.042 |
2.08 ± 0.026 | 5.159 ± 0.045 |
3.476 ± 0.047 | 8.897 ± 0.048 |
Met |
Asn |
Gln |
Pro |
Arg |
Ser |
Thr |
Val |
Trp |
Tyr |
|---|---|---|---|---|---|---|---|---|---|
2.545 ± 0.028 | 3.134 ± 0.031 |
4.911 ± 0.035 | 3.124 ± 0.029 |
6.455 ± 0.062 | 5.818 ± 0.042 |
5.928 ± 0.041 | 7.781 ± 0.042 |
1.476 ± 0.02 | 2.744 ± 0.027 |
Most of the basic statistics you can see at this page can be downloaded from this CSV file
See this proteome in:

Proteome-pI is available under Creative Commons Attribution-NoDerivs license, for more details see here
| Reference: Kozlowski LP. Proteome-pI 2.0: Proteome Isoelectric Point Database Update. Nucleic Acids Res. 2021, doi: 10.1093/nar/gkab944 | Contact: Lukasz P. Kozlowski |