Roseiarcus fermentans
Taxonomy: cellular organisms; Bacteria; Proteobacteria; Alphaproteobacteria; Hyphomicrobiales; Roseiarcaceae; Roseiarcus
Average proteome isoelectric point is 6.71
Get precalculated fractions of proteins
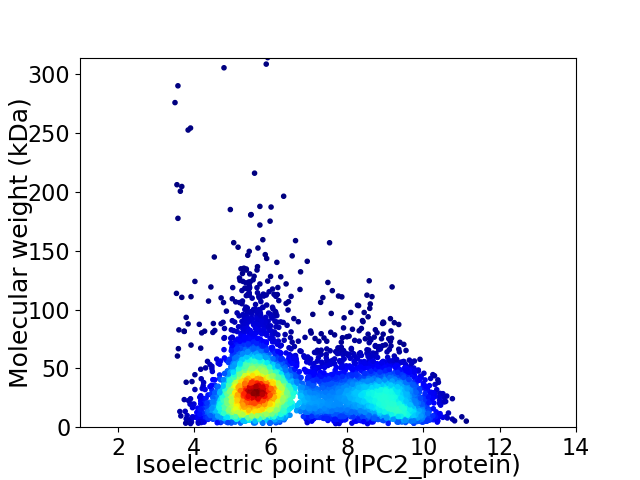
Virtual 2D-PAGE plot for 6190 proteins (isoelectric point calculated using IPC2_protein)
Get csv file with sequences according to given criteria:
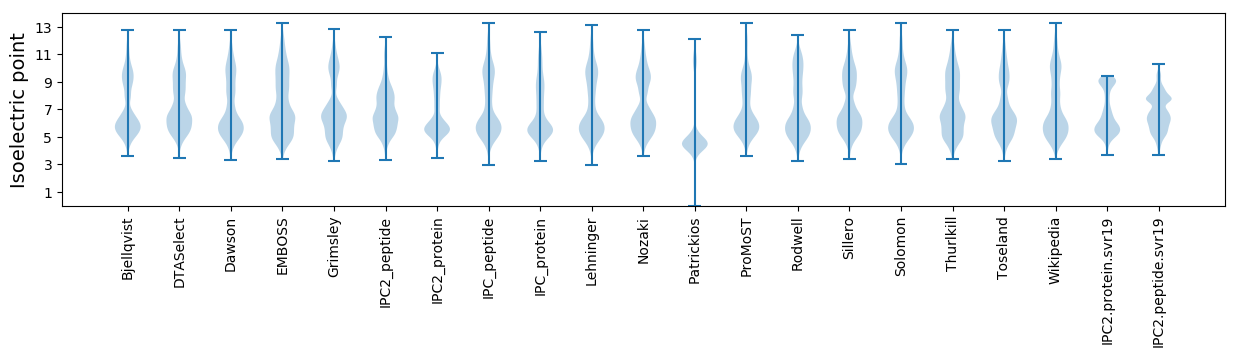
* You can choose from 21 different methods for calculating isoelectric point
Summary statistics related to proteome-wise predictions
Protein with the lowest isoelectric point:
>tr|A0A366F0Z4|A0A366F0Z4_9RHIZ Putative NADPH-quinone reductase OS=Roseiarcus fermentans OX=1473586 GN=DFR50_12754 PE=4 SV=1
MM1 pKa = 7.47YY2 pKa = 10.26SATQINMLRR11 pKa = 11.84DD12 pKa = 3.78LDD14 pKa = 4.15SGAPLPGIDD23 pKa = 3.83TEE25 pKa = 4.46VGNLQSEE32 pKa = 4.86SSLEE36 pKa = 4.28TPSSIPTTSSNQPFYY51 pKa = 11.27YY52 pKa = 10.29DD53 pKa = 3.44PSKK56 pKa = 10.75NTVFVQQAGAVLNGYY71 pKa = 9.97DD72 pKa = 3.53FGSANVVVVASDD84 pKa = 3.46VTIEE88 pKa = 3.8NCTFDD93 pKa = 3.45GTGGSFAIGAYY104 pKa = 7.2NTAWSPATTDD114 pKa = 3.19TTVTHH119 pKa = 6.04CTFVGDD125 pKa = 4.11PSSSLLAVINSPTGSATITDD145 pKa = 3.69NAFLDD150 pKa = 4.06TAGDD154 pKa = 4.32GVWADD159 pKa = 3.48GGGLISGNYY168 pKa = 8.98FSQAGNDD175 pKa = 3.99GAAGHH180 pKa = 7.44PDD182 pKa = 4.76GIWLSNSTSPMTVSDD197 pKa = 4.88NFIDD201 pKa = 3.92WSQNPAATGSTNDD214 pKa = 4.19CIRR217 pKa = 11.84ITGEE221 pKa = 3.96LGPVSNVTVTGNFLLNGATSISAVDD246 pKa = 3.83GSGPGALSDD255 pKa = 3.54IAITGNYY262 pKa = 9.25LVGPKK267 pKa = 10.11YY268 pKa = 9.37YY269 pKa = 10.25TFFPGSMSGSTVSGNVIADD288 pKa = 3.57QTSLSDD294 pKa = 3.12AWAAYY299 pKa = 8.71QAAGVPTATLLASTDD314 pKa = 3.34GSAVSAASATAPTTLYY330 pKa = 11.04ADD332 pKa = 3.53VRR334 pKa = 11.84NTLMVGGPNEE344 pKa = 4.22TNFVSGYY351 pKa = 10.56ASQNMWAGSGADD363 pKa = 2.89IFTYY367 pKa = 10.6LATGDD372 pKa = 4.12SSPAAADD379 pKa = 3.75YY380 pKa = 8.43ITNFDD385 pKa = 3.92PAKK388 pKa = 10.68DD389 pKa = 3.95VIDD392 pKa = 4.57LSRR395 pKa = 11.84VDD397 pKa = 4.59ANPGGAPEE405 pKa = 4.11TFAFIGANAFDD416 pKa = 4.11GAGPEE421 pKa = 3.81IRR423 pKa = 11.84TQAEE427 pKa = 3.83ADD429 pKa = 3.38GDD431 pKa = 4.45TIVQVALAGDD441 pKa = 4.19TTPDD445 pKa = 3.2MQIILTSSVPLTAANFAVTAAQSQAAIANGADD477 pKa = 3.09MGFSVTSGWPLTEE490 pKa = 3.55TTYY493 pKa = 11.73ANVQGRR499 pKa = 11.84PYY501 pKa = 11.2SDD503 pKa = 3.21FTSFRR508 pKa = 11.84SGSYY512 pKa = 10.16LVADD516 pKa = 4.52ALDD519 pKa = 4.36LGGSSDD525 pKa = 4.76EE526 pKa = 4.15IDD528 pKa = 4.3LFGKK532 pKa = 9.72PGAAVTITRR541 pKa = 11.84GDD543 pKa = 3.41GAEE546 pKa = 4.19QITSAGKK553 pKa = 7.68TDD555 pKa = 3.37SLAFHH560 pKa = 6.97ANEE563 pKa = 4.46TIAAGAAPAGEE574 pKa = 4.33TFAIGPGSGNVTIEE588 pKa = 3.78GFAASGANADD598 pKa = 4.48RR599 pKa = 11.84LQLSASAFSGLQSGMTDD616 pKa = 3.31AEE618 pKa = 4.22KK619 pKa = 10.64LAAALGDD626 pKa = 3.46VSTASGGASFTDD638 pKa = 3.51SAGDD642 pKa = 3.36RR643 pKa = 11.84LTLVGVAPATLTANPGLVKK662 pKa = 10.16FVV664 pKa = 3.36
MM1 pKa = 7.47YY2 pKa = 10.26SATQINMLRR11 pKa = 11.84DD12 pKa = 3.78LDD14 pKa = 4.15SGAPLPGIDD23 pKa = 3.83TEE25 pKa = 4.46VGNLQSEE32 pKa = 4.86SSLEE36 pKa = 4.28TPSSIPTTSSNQPFYY51 pKa = 11.27YY52 pKa = 10.29DD53 pKa = 3.44PSKK56 pKa = 10.75NTVFVQQAGAVLNGYY71 pKa = 9.97DD72 pKa = 3.53FGSANVVVVASDD84 pKa = 3.46VTIEE88 pKa = 3.8NCTFDD93 pKa = 3.45GTGGSFAIGAYY104 pKa = 7.2NTAWSPATTDD114 pKa = 3.19TTVTHH119 pKa = 6.04CTFVGDD125 pKa = 4.11PSSSLLAVINSPTGSATITDD145 pKa = 3.69NAFLDD150 pKa = 4.06TAGDD154 pKa = 4.32GVWADD159 pKa = 3.48GGGLISGNYY168 pKa = 8.98FSQAGNDD175 pKa = 3.99GAAGHH180 pKa = 7.44PDD182 pKa = 4.76GIWLSNSTSPMTVSDD197 pKa = 4.88NFIDD201 pKa = 3.92WSQNPAATGSTNDD214 pKa = 4.19CIRR217 pKa = 11.84ITGEE221 pKa = 3.96LGPVSNVTVTGNFLLNGATSISAVDD246 pKa = 3.83GSGPGALSDD255 pKa = 3.54IAITGNYY262 pKa = 9.25LVGPKK267 pKa = 10.11YY268 pKa = 9.37YY269 pKa = 10.25TFFPGSMSGSTVSGNVIADD288 pKa = 3.57QTSLSDD294 pKa = 3.12AWAAYY299 pKa = 8.71QAAGVPTATLLASTDD314 pKa = 3.34GSAVSAASATAPTTLYY330 pKa = 11.04ADD332 pKa = 3.53VRR334 pKa = 11.84NTLMVGGPNEE344 pKa = 4.22TNFVSGYY351 pKa = 10.56ASQNMWAGSGADD363 pKa = 2.89IFTYY367 pKa = 10.6LATGDD372 pKa = 4.12SSPAAADD379 pKa = 3.75YY380 pKa = 8.43ITNFDD385 pKa = 3.92PAKK388 pKa = 10.68DD389 pKa = 3.95VIDD392 pKa = 4.57LSRR395 pKa = 11.84VDD397 pKa = 4.59ANPGGAPEE405 pKa = 4.11TFAFIGANAFDD416 pKa = 4.11GAGPEE421 pKa = 3.81IRR423 pKa = 11.84TQAEE427 pKa = 3.83ADD429 pKa = 3.38GDD431 pKa = 4.45TIVQVALAGDD441 pKa = 4.19TTPDD445 pKa = 3.2MQIILTSSVPLTAANFAVTAAQSQAAIANGADD477 pKa = 3.09MGFSVTSGWPLTEE490 pKa = 3.55TTYY493 pKa = 11.73ANVQGRR499 pKa = 11.84PYY501 pKa = 11.2SDD503 pKa = 3.21FTSFRR508 pKa = 11.84SGSYY512 pKa = 10.16LVADD516 pKa = 4.52ALDD519 pKa = 4.36LGGSSDD525 pKa = 4.76EE526 pKa = 4.15IDD528 pKa = 4.3LFGKK532 pKa = 9.72PGAAVTITRR541 pKa = 11.84GDD543 pKa = 3.41GAEE546 pKa = 4.19QITSAGKK553 pKa = 7.68TDD555 pKa = 3.37SLAFHH560 pKa = 6.97ANEE563 pKa = 4.46TIAAGAAPAGEE574 pKa = 4.33TFAIGPGSGNVTIEE588 pKa = 3.78GFAASGANADD598 pKa = 4.48RR599 pKa = 11.84LQLSASAFSGLQSGMTDD616 pKa = 3.31AEE618 pKa = 4.22KK619 pKa = 10.64LAAALGDD626 pKa = 3.46VSTASGGASFTDD638 pKa = 3.51SAGDD642 pKa = 3.36RR643 pKa = 11.84LTLVGVAPATLTANPGLVKK662 pKa = 10.16FVV664 pKa = 3.36
Molecular weight: 66.75 kDa
Isoelectric point according different methods:
Protein with the highest isoelectric point:
>tr|A0A366FLI5|A0A366FLI5_9RHIZ UPF0114 protein DFR50_108120 OS=Roseiarcus fermentans OX=1473586 GN=DFR50_108120 PE=3 SV=1
MM1 pKa = 6.84TTRR4 pKa = 11.84TWTGILGVGALALAVSLALPATAQTTAPAPSAHH37 pKa = 6.81KK38 pKa = 11.02VPMHH42 pKa = 6.5PSALTLGSHH51 pKa = 5.85RR52 pKa = 11.84TRR54 pKa = 11.84PHH56 pKa = 5.26HH57 pKa = 6.1QGVGRR62 pKa = 11.84LGNTRR67 pKa = 11.84GRR69 pKa = 11.84QLHH72 pKa = 5.06TTPIHH77 pKa = 5.48GTMAGPRR84 pKa = 11.84II85 pKa = 3.98
MM1 pKa = 6.84TTRR4 pKa = 11.84TWTGILGVGALALAVSLALPATAQTTAPAPSAHH37 pKa = 6.81KK38 pKa = 11.02VPMHH42 pKa = 6.5PSALTLGSHH51 pKa = 5.85RR52 pKa = 11.84TRR54 pKa = 11.84PHH56 pKa = 5.26HH57 pKa = 6.1QGVGRR62 pKa = 11.84LGNTRR67 pKa = 11.84GRR69 pKa = 11.84QLHH72 pKa = 5.06TTPIHH77 pKa = 5.48GTMAGPRR84 pKa = 11.84II85 pKa = 3.98
Molecular weight: 8.82 kDa
Isoelectric point according different methods:
Peptides (in silico digests for buttom-up proteomics)
Below you can find in silico digests of the whole proteome with Trypsin, Chymotrypsin, Trypsin+LysC, LysN, ArgC proteases suitable for different mass spec machines.| Try ESI |
 |
|---|
| ChTry ESI |
|
|---|
| ArgC ESI |
|
|---|
| LysN ESI |
|
|---|
| TryLysC ESI |
|
|---|
| Try MALDI |
|
|---|
| ChTry MALDI |
|
|---|
| ArgC MALDI |
|
|---|
| LysN MALDI |
|
|---|
| TryLysC MALDI |
|
|---|
| Try LTQ |
|
|---|
| ChTry LTQ |
|
|---|
| ArgC LTQ |
|
|---|
| LysN LTQ |
|
|---|
| TryLysC LTQ |
|
|---|
| Try MSlow |
|
|---|
| ChTry MSlow |
|
|---|
| ArgC MSlow |
|
|---|
| LysN MSlow |
|
|---|
| TryLysC MSlow |
|
|---|
| Try MShigh |
|
|---|
| ChTry MShigh |
|
|---|
| ArgC MShigh |
|
|---|
| LysN MShigh |
|
|---|
| TryLysC MShigh |
|
|---|
General Statistics
Number of major isoforms |
Number of additional isoforms |
Number of all proteins |
Number of amino acids |
Min. Seq. Length |
Max. Seq. Length |
Avg. Seq. Length |
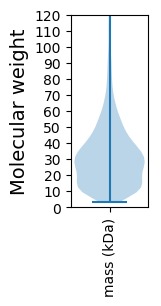
Avg. Mol. Weight |
|---|---|---|---|---|---|---|---|
0 |
1936078 |
28 |
3024 |
312.8 |
33.54 |
Amino acid frequency
Ala |
Cys |
Asp |
Glu |
Phe |
Gly |
His |
Ile |
Lys |
Leu |
|---|---|---|---|---|---|---|---|---|---|
14.584 ± 0.055 | 0.848 ± 0.009 |
5.687 ± 0.025 | 5.308 ± 0.032 |
3.734 ± 0.018 | 8.992 ± 0.039 |
1.82 ± 0.013 | 4.576 ± 0.021 |
2.796 ± 0.025 | 9.901 ± 0.036 |
Met |
Asn |
Gln |
Pro |
Arg |
Ser |
Thr |
Val |
Trp |
Tyr |
|---|---|---|---|---|---|---|---|---|---|
2.134 ± 0.015 | 2.306 ± 0.022 |
5.571 ± 0.031 | 2.597 ± 0.018 |
7.733 ± 0.049 | 5.289 ± 0.033 |
5.031 ± 0.04 | 7.646 ± 0.026 |
1.359 ± 0.014 | 2.086 ± 0.014 |
Most of the basic statistics you can see at this page can be downloaded from this CSV file
See this proteome in:

Proteome-pI is available under Creative Commons Attribution-NoDerivs license, for more details see here
| Reference: Kozlowski LP. Proteome-pI 2.0: Proteome Isoelectric Point Database Update. Nucleic Acids Res. 2021, doi: 10.1093/nar/gkab944 | Contact: Lukasz P. Kozlowski |