Dictyobacter sp. Uno17
Taxonomy: cellular organisms; Bacteria; Terrabacteria group; Chloroflexi; Ktedonobacteria; Ktedonobacterales; Dictyobacteraceae; Dictyobacter
Average proteome isoelectric point is 6.38
Get precalculated fractions of proteins
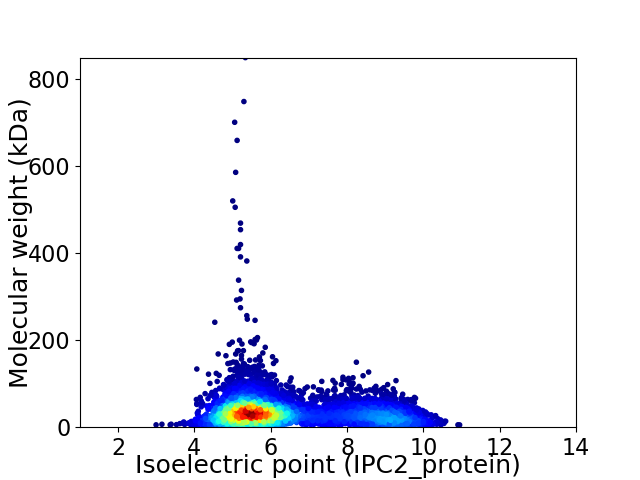
Virtual 2D-PAGE plot for 5628 proteins (isoelectric point calculated using IPC2_protein)
Get csv file with sequences according to given criteria:
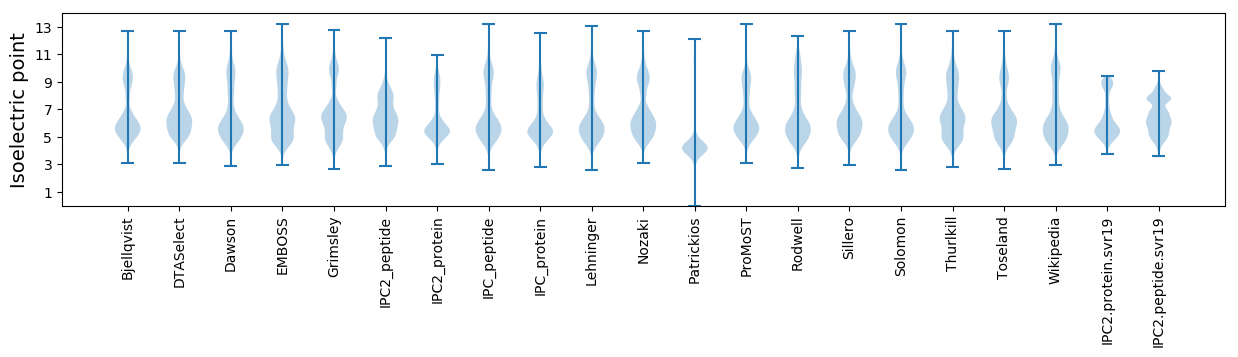
* You can choose from 21 different methods for calculating isoelectric point
Summary statistics related to proteome-wise predictions
Protein with the lowest isoelectric point:
>tr|A0A5A5TKA2|A0A5A5TKA2_9CHLR Uncharacterized protein OS=Dictyobacter sp. Uno17 OX=2014874 GN=yisX PE=4 SV=1
MM1 pKa = 7.64QEE3 pKa = 3.82ALKK6 pKa = 10.81ANPYY10 pKa = 10.17VYY12 pKa = 11.04ADD14 pKa = 3.63NNPVNEE20 pKa = 4.05VDD22 pKa = 3.6PNGAFSLTDD31 pKa = 3.05ACLVDD36 pKa = 4.74LVGLGGITSAVTGLFSFLGSSGAGGAVGIPLAAATGPGDD75 pKa = 3.52VAIAGLAASLFIGLAVTSSIIGIIGVIEE103 pKa = 4.07GVPTAKK109 pKa = 10.04KK110 pKa = 10.62DD111 pKa = 3.46CGLL114 pKa = 3.8
MM1 pKa = 7.64QEE3 pKa = 3.82ALKK6 pKa = 10.81ANPYY10 pKa = 10.17VYY12 pKa = 11.04ADD14 pKa = 3.63NNPVNEE20 pKa = 4.05VDD22 pKa = 3.6PNGAFSLTDD31 pKa = 3.05ACLVDD36 pKa = 4.74LVGLGGITSAVTGLFSFLGSSGAGGAVGIPLAAATGPGDD75 pKa = 3.52VAIAGLAASLFIGLAVTSSIIGIIGVIEE103 pKa = 4.07GVPTAKK109 pKa = 10.04KK110 pKa = 10.62DD111 pKa = 3.46CGLL114 pKa = 3.8
Molecular weight: 11.02 kDa
Isoelectric point according different methods:
Protein with the highest isoelectric point:
>tr|A0A5A5T5V4|A0A5A5T5V4_9CHLR NADH-quinone oxidoreductase subunit K OS=Dictyobacter sp. Uno17 OX=2014874 GN=nuoK1 PE=3 SV=1
MM1 pKa = 7.34SVALSPTFQVATIKK15 pKa = 10.32MLTIPTTIRR24 pKa = 11.84PSRR27 pKa = 11.84KK28 pKa = 8.35RR29 pKa = 11.84LRR31 pKa = 11.84ALRR34 pKa = 11.84VLSQRR39 pKa = 11.84LSIGLTPHH47 pKa = 7.02
MM1 pKa = 7.34SVALSPTFQVATIKK15 pKa = 10.32MLTIPTTIRR24 pKa = 11.84PSRR27 pKa = 11.84KK28 pKa = 8.35RR29 pKa = 11.84LRR31 pKa = 11.84ALRR34 pKa = 11.84VLSQRR39 pKa = 11.84LSIGLTPHH47 pKa = 7.02
Molecular weight: 5.26 kDa
Isoelectric point according different methods:
Peptides (in silico digests for buttom-up proteomics)
Below you can find in silico digests of the whole proteome with Trypsin, Chymotrypsin, Trypsin+LysC, LysN, ArgC proteases suitable for different mass spec machines.| Try ESI |
 |
|---|
| ChTry ESI |
|
|---|
| ArgC ESI |
|
|---|
| LysN ESI |
|
|---|
| TryLysC ESI |
|
|---|
| Try MALDI |
|
|---|
| ChTry MALDI |
|
|---|
| ArgC MALDI |
|
|---|
| LysN MALDI |
|
|---|
| TryLysC MALDI |
|
|---|
| Try LTQ |
|
|---|
| ChTry LTQ |
|
|---|
| ArgC LTQ |
|
|---|
| LysN LTQ |
|
|---|
| TryLysC LTQ |
|
|---|
| Try MSlow |
|
|---|
| ChTry MSlow |
|
|---|
| ArgC MSlow |
|
|---|
| LysN MSlow |
|
|---|
| TryLysC MSlow |
|
|---|
| Try MShigh |
|
|---|
| ChTry MShigh |
|
|---|
| ArgC MShigh |
|
|---|
| LysN MShigh |
|
|---|
| TryLysC MShigh |
|
|---|
General Statistics
Number of major isoforms |
Number of additional isoforms |
Number of all proteins |
Number of amino acids |
Min. Seq. Length |
Max. Seq. Length |
Avg. Seq. Length |
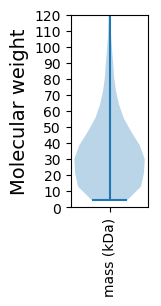
Avg. Mol. Weight |
|---|---|---|---|---|---|---|---|
0 |
1921236 |
40 |
7655 |
341.4 |
37.88 |
Amino acid frequency
Ala |
Cys |
Asp |
Glu |
Phe |
Gly |
His |
Ile |
Lys |
Leu |
|---|---|---|---|---|---|---|---|---|---|
9.274 ± 0.034 | 0.964 ± 0.01 |
4.83 ± 0.023 | 5.752 ± 0.037 |
3.595 ± 0.02 | 6.837 ± 0.032 |
2.713 ± 0.02 | 6.15 ± 0.026 |
3.383 ± 0.026 | 10.99 ± 0.043 |
Met |
Asn |
Gln |
Pro |
Arg |
Ser |
Thr |
Val |
Trp |
Tyr |
|---|---|---|---|---|---|---|---|---|---|
2.227 ± 0.013 | 3.497 ± 0.026 |
5.028 ± 0.027 | 5.412 ± 0.035 |
5.76 ± 0.033 | 6.238 ± 0.027 |
6.211 ± 0.029 | 6.593 ± 0.03 |
1.4 ± 0.013 | 3.141 ± 0.019 |
Most of the basic statistics you can see at this page can be downloaded from this CSV file
See this proteome in:

Proteome-pI is available under Creative Commons Attribution-NoDerivs license, for more details see here
| Reference: Kozlowski LP. Proteome-pI 2.0: Proteome Isoelectric Point Database Update. Nucleic Acids Res. 2021, doi: 10.1093/nar/gkab944 | Contact: Lukasz P. Kozlowski |