Prochlorococcus phage Syn1
Taxonomy: Viruses; Duplodnaviria; Heunggongvirae; Uroviricota; Caudoviricetes; Caudovirales; Myoviridae; Vellamovirus; Prochlorococcus virus Syn1
Average proteome isoelectric point is 6.02
Get precalculated fractions of proteins
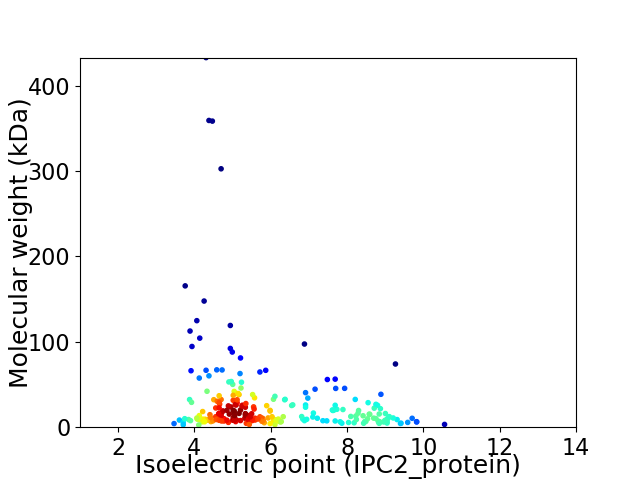
Virtual 2D-PAGE plot for 234 proteins (isoelectric point calculated using IPC2_protein)
Get csv file with sequences according to given criteria:
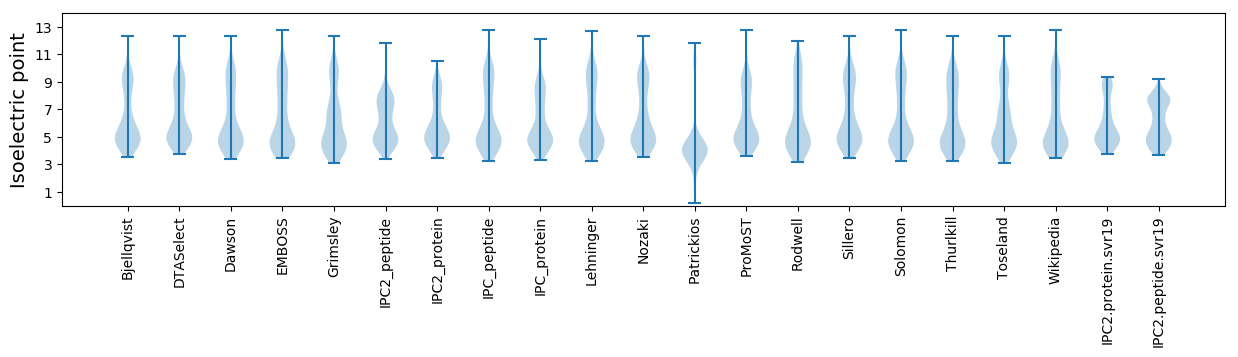
* You can choose from 21 different methods for calculating isoelectric point
Summary statistics related to proteome-wise predictions
Protein with the lowest isoelectric point:
>tr|E3SPF0|E3SPF0_9CAUD Uncharacterized protein OS=Prochlorococcus phage Syn1 OX=444861 GN=Syn1_065 PE=4 SV=1
MM1 pKa = 7.82IDD3 pKa = 3.98LHH5 pKa = 8.55DD6 pKa = 4.85SDD8 pKa = 5.79CCDD11 pKa = 3.4DD12 pKa = 4.41HH13 pKa = 8.8LQFEE17 pKa = 4.63QLTLDD22 pKa = 3.48VTII25 pKa = 5.0
MM1 pKa = 7.82IDD3 pKa = 3.98LHH5 pKa = 8.55DD6 pKa = 4.85SDD8 pKa = 5.79CCDD11 pKa = 3.4DD12 pKa = 4.41HH13 pKa = 8.8LQFEE17 pKa = 4.63QLTLDD22 pKa = 3.48VTII25 pKa = 5.0
Molecular weight: 2.92 kDa
Isoelectric point according different methods:
Protein with the highest isoelectric point:
>tr|E3SPG1|E3SPG1_9CAUD Uncharacterized protein OS=Prochlorococcus phage Syn1 OX=444861 GN=Syn1_076 PE=4 SV=1
MM1 pKa = 7.35TPCKK5 pKa = 10.2LSQPPRR11 pKa = 11.84RR12 pKa = 11.84YY13 pKa = 8.91SEE15 pKa = 4.1SYY17 pKa = 10.54GRR19 pKa = 11.84IQRR22 pKa = 11.84SHH24 pKa = 6.6RR25 pKa = 11.84GKK27 pKa = 10.26EE28 pKa = 3.67RR29 pKa = 11.84RR30 pKa = 11.84LSSFCEE36 pKa = 3.96FSKK39 pKa = 10.76SVKK42 pKa = 9.62YY43 pKa = 10.25QNSKK47 pKa = 10.58NLTFF51 pKa = 4.77
MM1 pKa = 7.35TPCKK5 pKa = 10.2LSQPPRR11 pKa = 11.84RR12 pKa = 11.84YY13 pKa = 8.91SEE15 pKa = 4.1SYY17 pKa = 10.54GRR19 pKa = 11.84IQRR22 pKa = 11.84SHH24 pKa = 6.6RR25 pKa = 11.84GKK27 pKa = 10.26EE28 pKa = 3.67RR29 pKa = 11.84RR30 pKa = 11.84LSSFCEE36 pKa = 3.96FSKK39 pKa = 10.76SVKK42 pKa = 9.62YY43 pKa = 10.25QNSKK47 pKa = 10.58NLTFF51 pKa = 4.77
Molecular weight: 6.1 kDa
Isoelectric point according different methods:
Peptides (in silico digests for buttom-up proteomics)
Below you can find in silico digests of the whole proteome with Trypsin, Chymotrypsin, Trypsin+LysC, LysN, ArgC proteases suitable for different mass spec machines.| Try ESI |
 |
|---|
| ChTry ESI |
|
|---|
| ArgC ESI |
|
|---|
| LysN ESI |
|
|---|
| TryLysC ESI |
|
|---|
| Try MALDI |
|
|---|
| ChTry MALDI |
|
|---|
| ArgC MALDI |
|
|---|
| LysN MALDI |
|
|---|
| TryLysC MALDI |
|
|---|
| Try LTQ |
|
|---|
| ChTry LTQ |
|
|---|
| ArgC LTQ |
|
|---|
| LysN LTQ |
|
|---|
| TryLysC LTQ |
|
|---|
| Try MSlow |
|
|---|
| ChTry MSlow |
|
|---|
| ArgC MSlow |
|
|---|
| LysN MSlow |
|
|---|
| TryLysC MSlow |
|
|---|
| Try MShigh |
|
|---|
| ChTry MShigh |
|
|---|
| ArgC MShigh |
|
|---|
| LysN MShigh |
|
|---|
| TryLysC MShigh |
|
|---|
General Statistics
Number of major isoforms |
Number of additional isoforms |
Number of all proteins |
Number of amino acids |
Min. Seq. Length |
Max. Seq. Length |
Avg. Seq. Length |
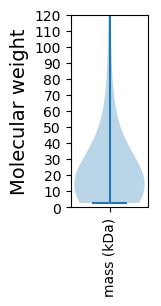
Avg. Mol. Weight |
|---|---|---|---|---|---|---|---|
0 |
62099 |
25 |
4017 |
265.4 |
29.38 |
Amino acid frequency
Ala |
Cys |
Asp |
Glu |
Phe |
Gly |
His |
Ile |
Lys |
Leu |
|---|---|---|---|---|---|---|---|---|---|
6.754 ± 0.217 | 0.873 ± 0.076 |
6.652 ± 0.119 | 6.003 ± 0.247 |
4.461 ± 0.101 | 7.95 ± 0.35 |
1.462 ± 0.117 | 6.449 ± 0.151 |
5.504 ± 0.383 | 7.219 ± 0.118 |
Met |
Asn |
Gln |
Pro |
Arg |
Ser |
Thr |
Val |
Trp |
Tyr |
|---|---|---|---|---|---|---|---|---|---|
2.064 ± 0.19 | 6.06 ± 0.194 |
4.024 ± 0.124 | 3.691 ± 0.101 |
4.018 ± 0.112 | 7.359 ± 0.213 |
7.615 ± 0.324 | 6.728 ± 0.169 |
1.079 ± 0.08 | 4.034 ± 0.139 |
Most of the basic statistics you can see at this page can be downloaded from this CSV file
See this proteome in:

Proteome-pI is available under Creative Commons Attribution-NoDerivs license, for more details see here
| Reference: Kozlowski LP. Proteome-pI 2.0: Proteome Isoelectric Point Database Update. Nucleic Acids Res. 2021, doi: 10.1093/nar/gkab944 | Contact: Lukasz P. Kozlowski |