Gulbenkiania indica
Taxonomy: cellular organisms; Bacteria; Proteobacteria; Betaproteobacteria; Neisseriales; Chromobacteriaceae; Gulbenkiania
Average proteome isoelectric point is 6.71
Get precalculated fractions of proteins
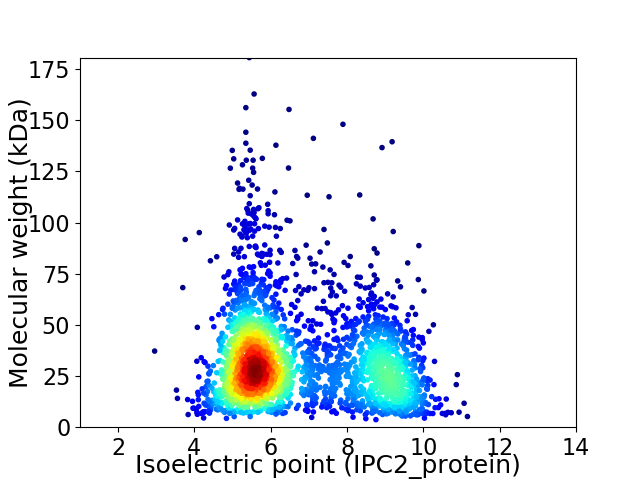
Virtual 2D-PAGE plot for 2697 proteins (isoelectric point calculated using IPC2_protein)
Get csv file with sequences according to given criteria:
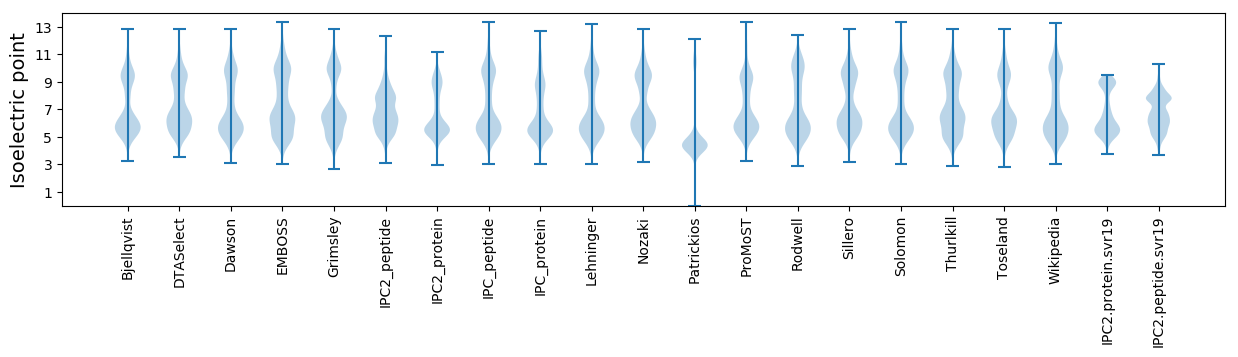
* You can choose from 21 different methods for calculating isoelectric point
Summary statistics related to proteome-wise predictions
Protein with the lowest isoelectric point:
>tr|A0A0K6H6S7|A0A0K6H6S7_9NEIS Uncharacterized protein OS=Gulbenkiania indica OX=375574 GN=Ga0061063_2760 PE=4 SV=1
MM1 pKa = 7.36NAPTEE6 pKa = 4.29MPTPINFTNSACDD19 pKa = 3.37KK20 pKa = 10.56VRR22 pKa = 11.84DD23 pKa = 4.4LIAEE27 pKa = 4.23EE28 pKa = 4.66GNPDD32 pKa = 2.99LKK34 pKa = 11.14LRR36 pKa = 11.84VFVTGGGCSGFQYY49 pKa = 10.94GFTFDD54 pKa = 4.65EE55 pKa = 4.88IANEE59 pKa = 4.13DD60 pKa = 3.34DD61 pKa = 3.58TAIEE65 pKa = 4.16RR66 pKa = 11.84EE67 pKa = 4.44GVTFLVDD74 pKa = 3.53PMSYY78 pKa = 10.19QYY80 pKa = 11.57LVGAEE85 pKa = 3.7IDD87 pKa = 3.88YY88 pKa = 11.15QEE90 pKa = 4.55SLEE93 pKa = 4.16GSQFVIRR100 pKa = 11.84NPNAQTTCGCGSSFSVV116 pKa = 3.54
MM1 pKa = 7.36NAPTEE6 pKa = 4.29MPTPINFTNSACDD19 pKa = 3.37KK20 pKa = 10.56VRR22 pKa = 11.84DD23 pKa = 4.4LIAEE27 pKa = 4.23EE28 pKa = 4.66GNPDD32 pKa = 2.99LKK34 pKa = 11.14LRR36 pKa = 11.84VFVTGGGCSGFQYY49 pKa = 10.94GFTFDD54 pKa = 4.65EE55 pKa = 4.88IANEE59 pKa = 4.13DD60 pKa = 3.34DD61 pKa = 3.58TAIEE65 pKa = 4.16RR66 pKa = 11.84EE67 pKa = 4.44GVTFLVDD74 pKa = 3.53PMSYY78 pKa = 10.19QYY80 pKa = 11.57LVGAEE85 pKa = 3.7IDD87 pKa = 3.88YY88 pKa = 11.15QEE90 pKa = 4.55SLEE93 pKa = 4.16GSQFVIRR100 pKa = 11.84NPNAQTTCGCGSSFSVV116 pKa = 3.54
Molecular weight: 12.65 kDa
Isoelectric point according different methods:
Protein with the highest isoelectric point:
>tr|A0A0K6GY63|A0A0K6GY63_9NEIS Biotin synthase OS=Gulbenkiania indica OX=375574 GN=bioB PE=3 SV=1
MM1 pKa = 8.13RR2 pKa = 11.84MLTPMRR8 pKa = 11.84MLTPMRR14 pKa = 11.84MLTPMRR20 pKa = 11.84MLTPMPTLTLTRR32 pKa = 11.84MLTPMLMPMPMLTRR46 pKa = 11.84MLTRR50 pKa = 11.84MPMLTRR56 pKa = 11.84MPMLTPMPMLTPMLTLTLTPMLTPMLTPMPMPMPTPMLTPMPTLVV101 pKa = 3.46
MM1 pKa = 8.13RR2 pKa = 11.84MLTPMRR8 pKa = 11.84MLTPMRR14 pKa = 11.84MLTPMRR20 pKa = 11.84MLTPMPTLTLTRR32 pKa = 11.84MLTPMLMPMPMLTRR46 pKa = 11.84MLTRR50 pKa = 11.84MPMLTRR56 pKa = 11.84MPMLTPMPMLTPMLTLTLTPMLTPMLTPMPMPMPTPMLTPMPTLVV101 pKa = 3.46
Molecular weight: 11.69 kDa
Isoelectric point according different methods:
Peptides (in silico digests for buttom-up proteomics)
Below you can find in silico digests of the whole proteome with Trypsin, Chymotrypsin, Trypsin+LysC, LysN, ArgC proteases suitable for different mass spec machines.| Try ESI |
 |
|---|
| ChTry ESI |
|
|---|
| ArgC ESI |
|
|---|
| LysN ESI |
|
|---|
| TryLysC ESI |
|
|---|
| Try MALDI |
|
|---|
| ChTry MALDI |
|
|---|
| ArgC MALDI |
|
|---|
| LysN MALDI |
|
|---|
| TryLysC MALDI |
|
|---|
| Try LTQ |
|
|---|
| ChTry LTQ |
|
|---|
| ArgC LTQ |
|
|---|
| LysN LTQ |
|
|---|
| TryLysC LTQ |
|
|---|
| Try MSlow |
|
|---|
| ChTry MSlow |
|
|---|
| ArgC MSlow |
|
|---|
| LysN MSlow |
|
|---|
| TryLysC MSlow |
|
|---|
| Try MShigh |
|
|---|
| ChTry MShigh |
|
|---|
| ArgC MShigh |
|
|---|
| LysN MShigh |
|
|---|
| TryLysC MShigh |
|
|---|
General Statistics
Number of major isoforms |
Number of additional isoforms |
Number of all proteins |
Number of amino acids |
Min. Seq. Length |
Max. Seq. Length |
Avg. Seq. Length |
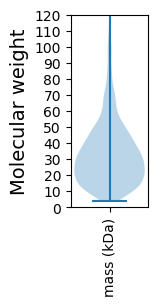
Avg. Mol. Weight |
|---|---|---|---|---|---|---|---|
0 |
858314 |
34 |
1603 |
318.2 |
34.78 |
Amino acid frequency
Ala |
Cys |
Asp |
Glu |
Phe |
Gly |
His |
Ile |
Lys |
Leu |
|---|---|---|---|---|---|---|---|---|---|
12.195 ± 0.065 | 0.925 ± 0.016 |
5.132 ± 0.034 | 5.953 ± 0.047 |
3.562 ± 0.035 | 8.012 ± 0.04 |
2.269 ± 0.023 | 4.33 ± 0.035 |
3.204 ± 0.043 | 11.425 ± 0.06 |
Met |
Asn |
Gln |
Pro |
Arg |
Ser |
Thr |
Val |
Trp |
Tyr |
|---|---|---|---|---|---|---|---|---|---|
2.467 ± 0.023 | 2.619 ± 0.027 |
5.202 ± 0.037 | 3.783 ± 0.034 |
7.195 ± 0.046 | 5.064 ± 0.036 |
5.158 ± 0.033 | 7.682 ± 0.044 |
1.386 ± 0.021 | 2.436 ± 0.024 |
Most of the basic statistics you can see at this page can be downloaded from this CSV file
See this proteome in:

Proteome-pI is available under Creative Commons Attribution-NoDerivs license, for more details see here
| Reference: Kozlowski LP. Proteome-pI 2.0: Proteome Isoelectric Point Database Update. Nucleic Acids Res. 2021, doi: 10.1093/nar/gkab944 | Contact: Lukasz P. Kozlowski |