Acetobacter sp. KACC 21233
Taxonomy: cellular organisms; Bacteria; Proteobacteria; Alphaproteobacteria; Rhodospirillales; Acetobacteraceae; Acetobacter; unclassified Acetobacter
Average proteome isoelectric point is 6.6
Get precalculated fractions of proteins
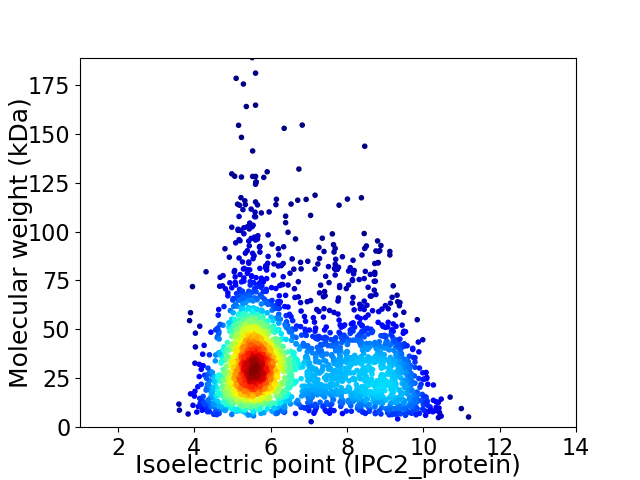
Virtual 2D-PAGE plot for 2638 proteins (isoelectric point calculated using IPC2_protein)
Get csv file with sequences according to given criteria:
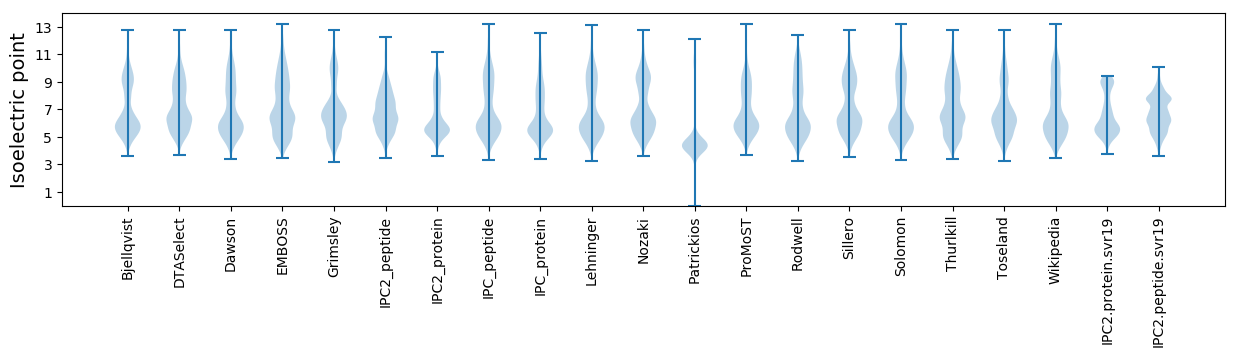
* You can choose from 21 different methods for calculating isoelectric point
Summary statistics related to proteome-wise predictions
Protein with the lowest isoelectric point:
>tr|A0A5C1YQA3|A0A5C1YQA3_9PROT LptF/LptG family permease OS=Acetobacter sp. KACC 21233 OX=2592655 GN=FLP30_09230 PE=4 SV=1
MM1 pKa = 7.75AGHH4 pKa = 6.93IPISQIVQVTPGVLAAGNGLNNLSGLIATTASAALAAGAVQSFASADD51 pKa = 3.49AVGTAFGDD59 pKa = 3.53TSMLYY64 pKa = 10.75QMAKK68 pKa = 10.26VYY70 pKa = 10.27FSGYY74 pKa = 7.35STAVMTPGTLYY85 pKa = 10.69VGAIAASASGATATASLGTVTEE107 pKa = 4.33HH108 pKa = 5.71TVATVAVDD116 pKa = 3.44AAGTGYY122 pKa = 11.22AVGDD126 pKa = 3.65TASFSGGKK134 pKa = 8.15ATISTVGTDD143 pKa = 3.81GAVTALTLQSATAQSDD159 pKa = 3.84DD160 pKa = 3.7PAGTGLATTTNGSGTGLTVTTTSTAATVSSGAVSSITVNAGGAGYY205 pKa = 6.63TTAPTVTLTGGGGTGAEE222 pKa = 4.08ASATVSGGAVTAITVTAGGSGYY244 pKa = 9.24TSAPAVTITAAASEE258 pKa = 4.36DD259 pKa = 3.52MAAQLSALRR268 pKa = 11.84SANGGWNGLAFDD280 pKa = 5.13AEE282 pKa = 4.39LSVADD287 pKa = 4.39KK288 pKa = 10.69QAAAQWVSQQNGQIFAPLMDD308 pKa = 5.0SDD310 pKa = 4.58SGAATSGSDD319 pKa = 3.1TAFGVWLGAQSISGVTAIYY338 pKa = 7.68DD339 pKa = 3.86TSPLSCALALGWMASLSFGTTDD361 pKa = 3.9GRR363 pKa = 11.84QTLAFVQDD371 pKa = 3.68ASGLITPAVTDD382 pKa = 3.55GTTAANLIANGYY394 pKa = 8.71SFYY397 pKa = 11.22GSYY400 pKa = 10.82AGGADD405 pKa = 3.18TFQFMRR411 pKa = 11.84PGQVSGKK418 pKa = 9.05FLWADD423 pKa = 3.37SFVNQIWLNANLTSDD438 pKa = 5.15LVNLLLNTGNIPYY451 pKa = 8.52NTEE454 pKa = 3.42GDD456 pKa = 4.07TLVNAAVQDD465 pKa = 4.3TITEE469 pKa = 4.09ALAFGAIQAGVALTTLQKK487 pKa = 10.49QQINNAAGVTTAADD501 pKa = 3.44NVVNRR506 pKa = 11.84GWYY509 pKa = 7.38FQPNVSTAAASYY521 pKa = 9.83RR522 pKa = 11.84VARR525 pKa = 11.84TTPPARR531 pKa = 11.84LWYY534 pKa = 10.27ADD536 pKa = 3.66GEE538 pKa = 4.88SVQSIQLNSVEE549 pKa = 4.35VQQ551 pKa = 2.97
MM1 pKa = 7.75AGHH4 pKa = 6.93IPISQIVQVTPGVLAAGNGLNNLSGLIATTASAALAAGAVQSFASADD51 pKa = 3.49AVGTAFGDD59 pKa = 3.53TSMLYY64 pKa = 10.75QMAKK68 pKa = 10.26VYY70 pKa = 10.27FSGYY74 pKa = 7.35STAVMTPGTLYY85 pKa = 10.69VGAIAASASGATATASLGTVTEE107 pKa = 4.33HH108 pKa = 5.71TVATVAVDD116 pKa = 3.44AAGTGYY122 pKa = 11.22AVGDD126 pKa = 3.65TASFSGGKK134 pKa = 8.15ATISTVGTDD143 pKa = 3.81GAVTALTLQSATAQSDD159 pKa = 3.84DD160 pKa = 3.7PAGTGLATTTNGSGTGLTVTTTSTAATVSSGAVSSITVNAGGAGYY205 pKa = 6.63TTAPTVTLTGGGGTGAEE222 pKa = 4.08ASATVSGGAVTAITVTAGGSGYY244 pKa = 9.24TSAPAVTITAAASEE258 pKa = 4.36DD259 pKa = 3.52MAAQLSALRR268 pKa = 11.84SANGGWNGLAFDD280 pKa = 5.13AEE282 pKa = 4.39LSVADD287 pKa = 4.39KK288 pKa = 10.69QAAAQWVSQQNGQIFAPLMDD308 pKa = 5.0SDD310 pKa = 4.58SGAATSGSDD319 pKa = 3.1TAFGVWLGAQSISGVTAIYY338 pKa = 7.68DD339 pKa = 3.86TSPLSCALALGWMASLSFGTTDD361 pKa = 3.9GRR363 pKa = 11.84QTLAFVQDD371 pKa = 3.68ASGLITPAVTDD382 pKa = 3.55GTTAANLIANGYY394 pKa = 8.71SFYY397 pKa = 11.22GSYY400 pKa = 10.82AGGADD405 pKa = 3.18TFQFMRR411 pKa = 11.84PGQVSGKK418 pKa = 9.05FLWADD423 pKa = 3.37SFVNQIWLNANLTSDD438 pKa = 5.15LVNLLLNTGNIPYY451 pKa = 8.52NTEE454 pKa = 3.42GDD456 pKa = 4.07TLVNAAVQDD465 pKa = 4.3TITEE469 pKa = 4.09ALAFGAIQAGVALTTLQKK487 pKa = 10.49QQINNAAGVTTAADD501 pKa = 3.44NVVNRR506 pKa = 11.84GWYY509 pKa = 7.38FQPNVSTAAASYY521 pKa = 9.83RR522 pKa = 11.84VARR525 pKa = 11.84TTPPARR531 pKa = 11.84LWYY534 pKa = 10.27ADD536 pKa = 3.66GEE538 pKa = 4.88SVQSIQLNSVEE549 pKa = 4.35VQQ551 pKa = 2.97
Molecular weight: 54.47 kDa
Isoelectric point according different methods:
Protein with the highest isoelectric point:
>tr|A0A5C1YNM1|A0A5C1YNM1_9PROT ABC transporter permease subunit OS=Acetobacter sp. KACC 21233 OX=2592655 GN=FLP30_02880 PE=3 SV=1
MM1 pKa = 7.35KK2 pKa = 9.4RR3 pKa = 11.84TYY5 pKa = 10.2QPSRR9 pKa = 11.84LVRR12 pKa = 11.84KK13 pKa = 8.99RR14 pKa = 11.84RR15 pKa = 11.84HH16 pKa = 4.7GFRR19 pKa = 11.84SRR21 pKa = 11.84MATVGGRR28 pKa = 11.84RR29 pKa = 11.84ILGNRR34 pKa = 11.84RR35 pKa = 11.84AKK37 pKa = 9.79GRR39 pKa = 11.84KK40 pKa = 8.87RR41 pKa = 11.84LSAA44 pKa = 3.96
MM1 pKa = 7.35KK2 pKa = 9.4RR3 pKa = 11.84TYY5 pKa = 10.2QPSRR9 pKa = 11.84LVRR12 pKa = 11.84KK13 pKa = 8.99RR14 pKa = 11.84RR15 pKa = 11.84HH16 pKa = 4.7GFRR19 pKa = 11.84SRR21 pKa = 11.84MATVGGRR28 pKa = 11.84RR29 pKa = 11.84ILGNRR34 pKa = 11.84RR35 pKa = 11.84AKK37 pKa = 9.79GRR39 pKa = 11.84KK40 pKa = 8.87RR41 pKa = 11.84LSAA44 pKa = 3.96
Molecular weight: 5.22 kDa
Isoelectric point according different methods:
Peptides (in silico digests for buttom-up proteomics)
Below you can find in silico digests of the whole proteome with Trypsin, Chymotrypsin, Trypsin+LysC, LysN, ArgC proteases suitable for different mass spec machines.| Try ESI |
 |
|---|
| ChTry ESI |
|
|---|
| ArgC ESI |
|
|---|
| LysN ESI |
|
|---|
| TryLysC ESI |
|
|---|
| Try MALDI |
|
|---|
| ChTry MALDI |
|
|---|
| ArgC MALDI |
|
|---|
| LysN MALDI |
|
|---|
| TryLysC MALDI |
|
|---|
| Try LTQ |
|
|---|
| ChTry LTQ |
|
|---|
| ArgC LTQ |
|
|---|
| LysN LTQ |
|
|---|
| TryLysC LTQ |
|
|---|
| Try MSlow |
|
|---|
| ChTry MSlow |
|
|---|
| ArgC MSlow |
|
|---|
| LysN MSlow |
|
|---|
| TryLysC MSlow |
|
|---|
| Try MShigh |
|
|---|
| ChTry MShigh |
|
|---|
| ArgC MShigh |
|
|---|
| LysN MShigh |
|
|---|
| TryLysC MShigh |
|
|---|
General Statistics
Number of major isoforms |
Number of additional isoforms |
Number of all proteins |
Number of amino acids |
Min. Seq. Length |
Max. Seq. Length |
Avg. Seq. Length |
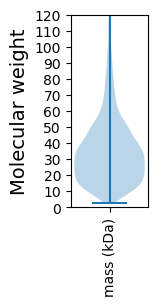
Avg. Mol. Weight |
|---|---|---|---|---|---|---|---|
0 |
885515 |
26 |
1708 |
335.7 |
36.41 |
Amino acid frequency
Ala |
Cys |
Asp |
Glu |
Phe |
Gly |
His |
Ile |
Lys |
Leu |
|---|---|---|---|---|---|---|---|---|---|
12.067 ± 0.069 | 1.063 ± 0.016 |
5.419 ± 0.039 | 4.985 ± 0.048 |
3.407 ± 0.031 | 8.307 ± 0.044 |
2.434 ± 0.021 | 4.608 ± 0.036 |
2.752 ± 0.038 | 10.572 ± 0.059 |
Met |
Asn |
Gln |
Pro |
Arg |
Ser |
Thr |
Val |
Trp |
Tyr |
|---|---|---|---|---|---|---|---|---|---|
2.509 ± 0.024 | 2.613 ± 0.031 |
5.59 ± 0.044 | 3.983 ± 0.031 |
6.936 ± 0.054 | 5.741 ± 0.038 |
5.984 ± 0.039 | 7.398 ± 0.047 |
1.394 ± 0.021 | 2.239 ± 0.031 |
Most of the basic statistics you can see at this page can be downloaded from this CSV file
See this proteome in:

Proteome-pI is available under Creative Commons Attribution-NoDerivs license, for more details see here
| Reference: Kozlowski LP. Proteome-pI 2.0: Proteome Isoelectric Point Database Update. Nucleic Acids Res. 2021, doi: 10.1093/nar/gkab944 | Contact: Lukasz P. Kozlowski |