Synechococcus phage S-CAM3
Taxonomy: Viruses; Duplodnaviria; Heunggongvirae; Uroviricota; Caudoviricetes; Caudovirales; Myoviridae; Charybdisvirus; Synechococcus virus SCAM3
Average proteome isoelectric point is 5.69
Get precalculated fractions of proteins
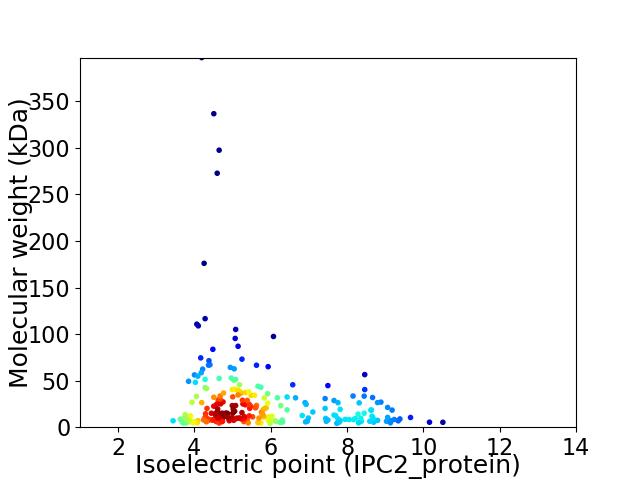
Virtual 2D-PAGE plot for 240 proteins (isoelectric point calculated using IPC2_protein)
Get csv file with sequences according to given criteria:
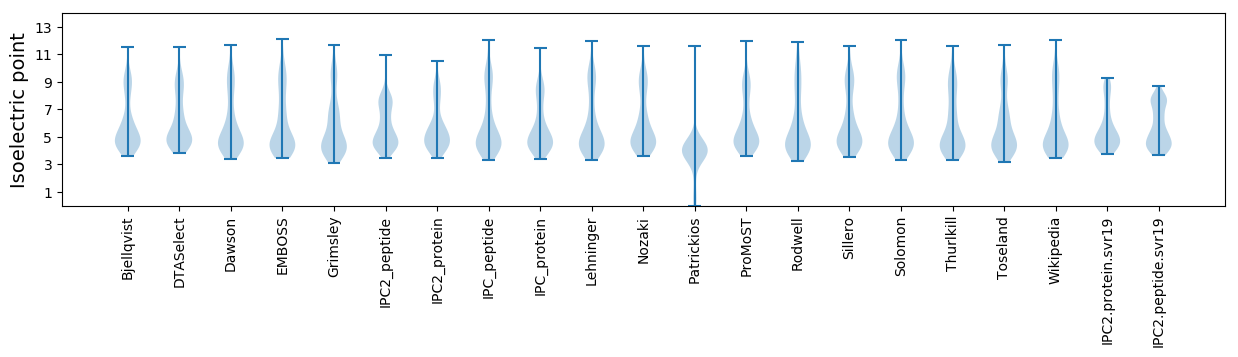
* You can choose from 21 different methods for calculating isoelectric point
Summary statistics related to proteome-wise predictions
Protein with the lowest isoelectric point:
>tr|A0A1D8KIV3|A0A1D8KIV3_9CAUD Baseplate wedge subunit OS=Synechococcus phage S-CAM3 OX=1883366 GN=C421010_084 PE=4 SV=1
MM1 pKa = 7.38TDD3 pKa = 3.03KK4 pKa = 11.11EE5 pKa = 4.32FVDD8 pKa = 4.48FLFDD12 pKa = 3.87KK13 pKa = 10.95LVTHH17 pKa = 6.92VDD19 pKa = 2.71TDD21 pKa = 4.03MIDD24 pKa = 3.31LHH26 pKa = 8.55DD27 pKa = 6.07DD28 pKa = 4.08DD29 pKa = 5.39SCCDD33 pKa = 3.42HH34 pKa = 8.14LEE36 pKa = 4.11FEE38 pKa = 4.38QLSLNVTCC46 pKa = 6.12
MM1 pKa = 7.38TDD3 pKa = 3.03KK4 pKa = 11.11EE5 pKa = 4.32FVDD8 pKa = 4.48FLFDD12 pKa = 3.87KK13 pKa = 10.95LVTHH17 pKa = 6.92VDD19 pKa = 2.71TDD21 pKa = 4.03MIDD24 pKa = 3.31LHH26 pKa = 8.55DD27 pKa = 6.07DD28 pKa = 4.08DD29 pKa = 5.39SCCDD33 pKa = 3.42HH34 pKa = 8.14LEE36 pKa = 4.11FEE38 pKa = 4.38QLSLNVTCC46 pKa = 6.12
Molecular weight: 5.39 kDa
Isoelectric point according different methods:
Protein with the highest isoelectric point:
>tr|A0A1D8KJA5|A0A1D8KJA5_9CAUD Ribonuclease H OS=Synechococcus phage S-CAM3 OX=1883366 GN=C421010_226 PE=4 SV=1
MM1 pKa = 7.88LIYY4 pKa = 10.18TVFKK8 pKa = 10.68RR9 pKa = 11.84LQSLLFWTGVRR20 pKa = 11.84FPSLPFLGVPWFRR33 pKa = 11.84QGKK36 pKa = 9.26KK37 pKa = 8.28VVIVDD42 pKa = 3.55GTKK45 pKa = 9.94PP46 pKa = 3.09
MM1 pKa = 7.88LIYY4 pKa = 10.18TVFKK8 pKa = 10.68RR9 pKa = 11.84LQSLLFWTGVRR20 pKa = 11.84FPSLPFLGVPWFRR33 pKa = 11.84QGKK36 pKa = 9.26KK37 pKa = 8.28VVIVDD42 pKa = 3.55GTKK45 pKa = 9.94PP46 pKa = 3.09
Molecular weight: 5.37 kDa
Isoelectric point according different methods:
Peptides (in silico digests for buttom-up proteomics)
Below you can find in silico digests of the whole proteome with Trypsin, Chymotrypsin, Trypsin+LysC, LysN, ArgC proteases suitable for different mass spec machines.| Try ESI |
 |
|---|
| ChTry ESI |
|
|---|
| ArgC ESI |
|
|---|
| LysN ESI |
|
|---|
| TryLysC ESI |
|
|---|
| Try MALDI |
|
|---|
| ChTry MALDI |
|
|---|
| ArgC MALDI |
|
|---|
| LysN MALDI |
|
|---|
| TryLysC MALDI |
|
|---|
| Try LTQ |
|
|---|
| ChTry LTQ |
|
|---|
| ArgC LTQ |
|
|---|
| LysN LTQ |
|
|---|
| TryLysC LTQ |
|
|---|
| Try MSlow |
|
|---|
| ChTry MSlow |
|
|---|
| ArgC MSlow |
|
|---|
| LysN MSlow |
|
|---|
| TryLysC MSlow |
|
|---|
| Try MShigh |
|
|---|
| ChTry MShigh |
|
|---|
| ArgC MShigh |
|
|---|
| LysN MShigh |
|
|---|
| TryLysC MShigh |
|
|---|
General Statistics
Number of major isoforms |
Number of additional isoforms |
Number of all proteins |
Number of amino acids |
Min. Seq. Length |
Max. Seq. Length |
Avg. Seq. Length |
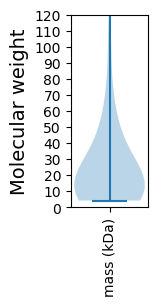
Avg. Mol. Weight |
|---|---|---|---|---|---|---|---|
0 |
62505 |
37 |
3673 |
260.4 |
28.85 |
Amino acid frequency
Ala |
Cys |
Asp |
Glu |
Phe |
Gly |
His |
Ile |
Lys |
Leu |
|---|---|---|---|---|---|---|---|---|---|
6.667 ± 0.239 | 0.976 ± 0.107 |
6.833 ± 0.175 | 6.318 ± 0.205 |
4.401 ± 0.174 | 8.18 ± 0.335 |
1.485 ± 0.095 | 6.385 ± 0.115 |
5.526 ± 0.34 | 7.004 ± 0.135 |
Met |
Asn |
Gln |
Pro |
Arg |
Ser |
Thr |
Val |
Trp |
Tyr |
|---|---|---|---|---|---|---|---|---|---|
1.925 ± 0.159 | 5.513 ± 0.199 |
4.126 ± 0.11 | 3.565 ± 0.094 |
3.976 ± 0.113 | 7.329 ± 0.281 |
7.431 ± 0.294 | 6.843 ± 0.129 |
1.082 ± 0.068 | 4.436 ± 0.144 |
Most of the basic statistics you can see at this page can be downloaded from this CSV file
See this proteome in:

Proteome-pI is available under Creative Commons Attribution-NoDerivs license, for more details see here
| Reference: Kozlowski LP. Proteome-pI 2.0: Proteome Isoelectric Point Database Update. Nucleic Acids Res. 2021, doi: 10.1093/nar/gkab944 | Contact: Lukasz P. Kozlowski |