Acinetobacter phage VB_ApiP_XC38
Taxonomy: Viruses; Duplodnaviria; Heunggongvirae; Uroviricota; Caudoviricetes; Caudovirales; Schitoviridae; Presleyvirus; unclassified Presleyvirus
Average proteome isoelectric point is 6.32
Get precalculated fractions of proteins
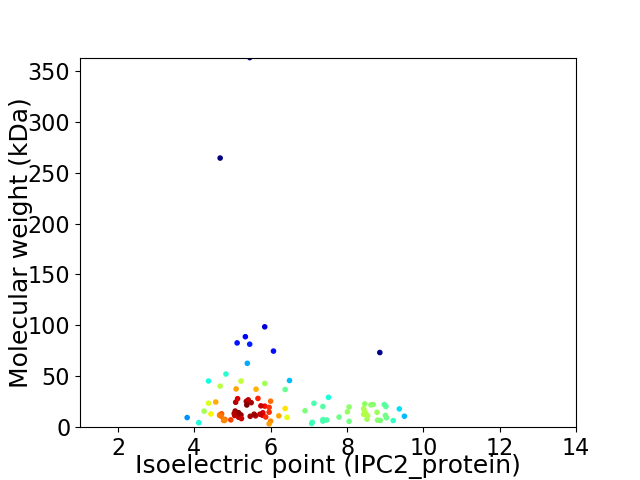
Virtual 2D-PAGE plot for 96 proteins (isoelectric point calculated using IPC2_protein)
Get csv file with sequences according to given criteria:
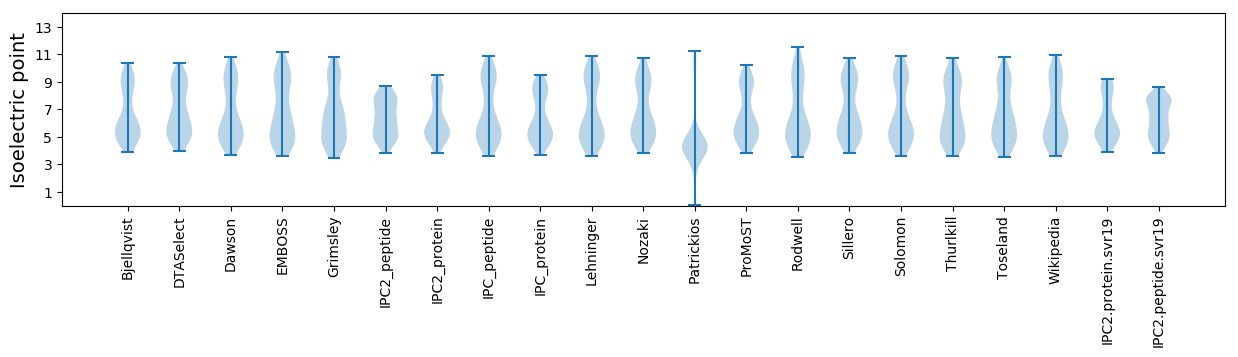
* You can choose from 21 different methods for calculating isoelectric point
Summary statistics related to proteome-wise predictions
Protein with the lowest isoelectric point:
>tr|A0A5P8PR49|A0A5P8PR49_9CAUD Uncharacterized protein OS=Acinetobacter phage VB_ApiP_XC38 OX=2655002 GN=VBApiPXC38_62 PE=4 SV=1
MM1 pKa = 7.34SLFVAWAAKK10 pKa = 8.45VTVINYY16 pKa = 9.57LGIAISVPTEE26 pKa = 3.69FLEE29 pKa = 4.25NGYY32 pKa = 9.78IAMDD36 pKa = 3.23VDD38 pKa = 4.09GTVV41 pKa = 2.7
MM1 pKa = 7.34SLFVAWAAKK10 pKa = 8.45VTVINYY16 pKa = 9.57LGIAISVPTEE26 pKa = 3.69FLEE29 pKa = 4.25NGYY32 pKa = 9.78IAMDD36 pKa = 3.23VDD38 pKa = 4.09GTVV41 pKa = 2.7
Molecular weight: 4.42 kDa
Isoelectric point according different methods:
Protein with the highest isoelectric point:
>tr|A0A5P8PR51|A0A5P8PR51_9CAUD Uncharacterized protein OS=Acinetobacter phage VB_ApiP_XC38 OX=2655002 GN=VBApiPXC38_49 PE=4 SV=1
MM1 pKa = 7.19YY2 pKa = 9.69RR3 pKa = 11.84DD4 pKa = 3.44QEE6 pKa = 4.41IISFMVAILMSCVTAYY22 pKa = 10.77VSIVRR27 pKa = 11.84KK28 pKa = 9.47VMRR31 pKa = 11.84KK32 pKa = 9.04RR33 pKa = 11.84GKK35 pKa = 8.18ITKK38 pKa = 9.0LWLSSEE44 pKa = 4.16VMMCLLAFLIALEE57 pKa = 4.92LYY59 pKa = 9.46PHH61 pKa = 7.28LASLMPAFMTKK72 pKa = 10.29AIFASTCVHH81 pKa = 5.64MSSRR85 pKa = 11.84LVMFLEE91 pKa = 4.16EE92 pKa = 4.02RR93 pKa = 11.84VNRR96 pKa = 11.84ALSSSS101 pKa = 3.42
MM1 pKa = 7.19YY2 pKa = 9.69RR3 pKa = 11.84DD4 pKa = 3.44QEE6 pKa = 4.41IISFMVAILMSCVTAYY22 pKa = 10.77VSIVRR27 pKa = 11.84KK28 pKa = 9.47VMRR31 pKa = 11.84KK32 pKa = 9.04RR33 pKa = 11.84GKK35 pKa = 8.18ITKK38 pKa = 9.0LWLSSEE44 pKa = 4.16VMMCLLAFLIALEE57 pKa = 4.92LYY59 pKa = 9.46PHH61 pKa = 7.28LASLMPAFMTKK72 pKa = 10.29AIFASTCVHH81 pKa = 5.64MSSRR85 pKa = 11.84LVMFLEE91 pKa = 4.16EE92 pKa = 4.02RR93 pKa = 11.84VNRR96 pKa = 11.84ALSSSS101 pKa = 3.42
Molecular weight: 11.56 kDa
Isoelectric point according different methods:
Peptides (in silico digests for buttom-up proteomics)
Below you can find in silico digests of the whole proteome with Trypsin, Chymotrypsin, Trypsin+LysC, LysN, ArgC proteases suitable for different mass spec machines.| Try ESI |
 |
|---|
| ChTry ESI |
|
|---|
| ArgC ESI |
|
|---|
| LysN ESI |
|
|---|
| TryLysC ESI |
|
|---|
| Try MALDI |
|
|---|
| ChTry MALDI |
|
|---|
| ArgC MALDI |
|
|---|
| LysN MALDI |
|
|---|
| TryLysC MALDI |
|
|---|
| Try LTQ |
|
|---|
| ChTry LTQ |
|
|---|
| ArgC LTQ |
|
|---|
| LysN LTQ |
|
|---|
| TryLysC LTQ |
|
|---|
| Try MSlow |
|
|---|
| ChTry MSlow |
|
|---|
| ArgC MSlow |
|
|---|
| LysN MSlow |
|
|---|
| TryLysC MSlow |
|
|---|
| Try MShigh |
|
|---|
| ChTry MShigh |
|
|---|
| ArgC MShigh |
|
|---|
| LysN MShigh |
|
|---|
| TryLysC MShigh |
|
|---|
General Statistics
Number of major isoforms |
Number of additional isoforms |
Number of all proteins |
Number of amino acids |
Min. Seq. Length |
Max. Seq. Length |
Avg. Seq. Length |
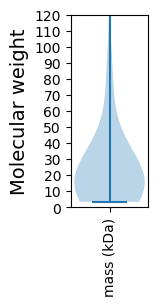
Avg. Mol. Weight |
|---|---|---|---|---|---|---|---|
0 |
24159 |
30 |
3323 |
251.7 |
28.04 |
Amino acid frequency
Ala |
Cys |
Asp |
Glu |
Phe |
Gly |
His |
Ile |
Lys |
Leu |
|---|---|---|---|---|---|---|---|---|---|
8.75 ± 0.453 | 0.811 ± 0.162 |
5.977 ± 0.152 | 6.391 ± 0.263 |
3.427 ± 0.214 | 5.932 ± 0.179 |
1.838 ± 0.195 | 6.027 ± 0.241 |
6.726 ± 0.266 | 8.763 ± 0.218 |
Met |
Asn |
Gln |
Pro |
Arg |
Ser |
Thr |
Val |
Trp |
Tyr |
|---|---|---|---|---|---|---|---|---|---|
2.736 ± 0.196 | 5.691 ± 0.233 |
3.564 ± 0.293 | 4.607 ± 0.288 |
4.143 ± 0.169 | 6.465 ± 0.494 |
6.817 ± 0.485 | 6.759 ± 0.214 |
1.018 ± 0.094 | 3.556 ± 0.264 |
Most of the basic statistics you can see at this page can be downloaded from this CSV file
See this proteome in:

Proteome-pI is available under Creative Commons Attribution-NoDerivs license, for more details see here
| Reference: Kozlowski LP. Proteome-pI 2.0: Proteome Isoelectric Point Database Update. Nucleic Acids Res. 2021, doi: 10.1093/nar/gkab944 | Contact: Lukasz P. Kozlowski |