Mycobacterium phage KristaRAM
Taxonomy: Viruses; Duplodnaviria; Heunggongvirae; Uroviricota; Caudoviricetes; Caudovirales; Siphoviridae; Cheoctovirus; unclassified Cheoctovirus
Average proteome isoelectric point is 6.11
Get precalculated fractions of proteins
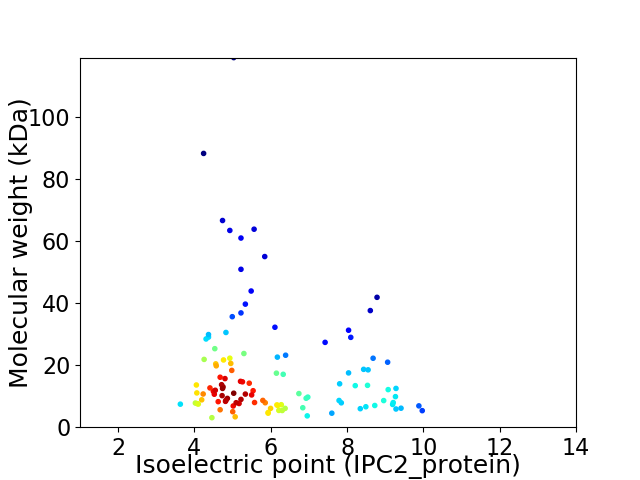
Virtual 2D-PAGE plot for 113 proteins (isoelectric point calculated using IPC2_protein)
Get csv file with sequences according to given criteria:
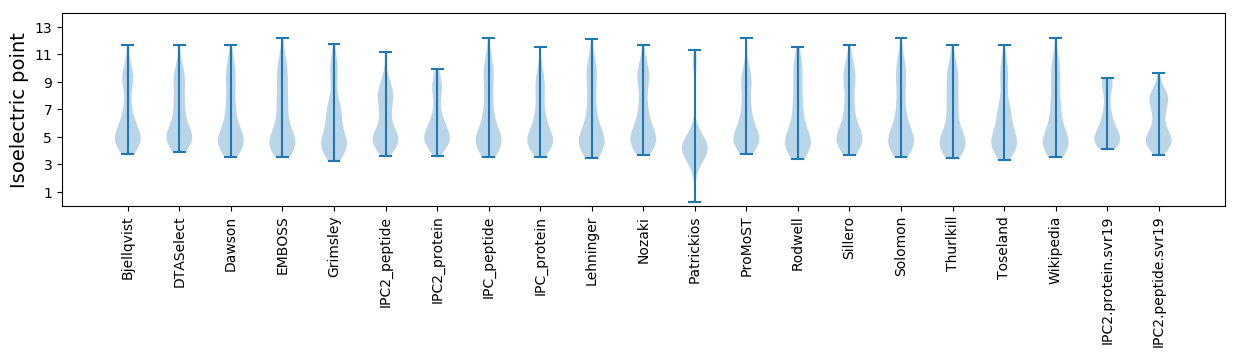
* You can choose from 21 different methods for calculating isoelectric point
Summary statistics related to proteome-wise predictions
Protein with the lowest isoelectric point:
>tr|A0A385DZX9|A0A385DZX9_9CAUD Uncharacterized protein OS=Mycobacterium phage KristaRAM OX=2301700 GN=48 PE=4 SV=1
MM1 pKa = 7.37SHH3 pKa = 5.68EE4 pKa = 4.77HH5 pKa = 7.34GEE7 pKa = 3.98IDD9 pKa = 5.14PISQLEE15 pKa = 4.11LDD17 pKa = 3.99VLEE20 pKa = 5.24SGDD23 pKa = 4.97LEE25 pKa = 4.79LATQVGEE32 pKa = 4.3VARR35 pKa = 11.84WAYY38 pKa = 8.21ATTVEE43 pKa = 4.98SIWALLCLPSEE54 pKa = 4.6VAEE57 pKa = 3.99QMVNEE62 pKa = 4.22WFLRR66 pKa = 3.83
MM1 pKa = 7.37SHH3 pKa = 5.68EE4 pKa = 4.77HH5 pKa = 7.34GEE7 pKa = 3.98IDD9 pKa = 5.14PISQLEE15 pKa = 4.11LDD17 pKa = 3.99VLEE20 pKa = 5.24SGDD23 pKa = 4.97LEE25 pKa = 4.79LATQVGEE32 pKa = 4.3VARR35 pKa = 11.84WAYY38 pKa = 8.21ATTVEE43 pKa = 4.98SIWALLCLPSEE54 pKa = 4.6VAEE57 pKa = 3.99QMVNEE62 pKa = 4.22WFLRR66 pKa = 3.83
Molecular weight: 7.46 kDa
Isoelectric point according different methods:
Protein with the highest isoelectric point:
>tr|A0A385DZF2|A0A385DZF2_9CAUD Uncharacterized protein OS=Mycobacterium phage KristaRAM OX=2301700 GN=10 PE=4 SV=1
MM1 pKa = 6.67TTFPAPRR8 pKa = 11.84TLTEE12 pKa = 5.09RR13 pKa = 11.84IQGAHH18 pKa = 6.7LNLKK22 pKa = 9.83LARR25 pKa = 11.84QAGNPDD31 pKa = 3.49IIAAAEE37 pKa = 4.34RR38 pKa = 11.84ILNQLVDD45 pKa = 4.1RR46 pKa = 11.84LPRR49 pKa = 11.84STSQEE54 pKa = 3.91KK55 pKa = 10.38
MM1 pKa = 6.67TTFPAPRR8 pKa = 11.84TLTEE12 pKa = 5.09RR13 pKa = 11.84IQGAHH18 pKa = 6.7LNLKK22 pKa = 9.83LARR25 pKa = 11.84QAGNPDD31 pKa = 3.49IIAAAEE37 pKa = 4.34RR38 pKa = 11.84ILNQLVDD45 pKa = 4.1RR46 pKa = 11.84LPRR49 pKa = 11.84STSQEE54 pKa = 3.91KK55 pKa = 10.38
Molecular weight: 6.12 kDa
Isoelectric point according different methods:
Peptides (in silico digests for buttom-up proteomics)
Below you can find in silico digests of the whole proteome with Trypsin, Chymotrypsin, Trypsin+LysC, LysN, ArgC proteases suitable for different mass spec machines.| Try ESI |
 |
|---|
| ChTry ESI |
|
|---|
| ArgC ESI |
|
|---|
| LysN ESI |
|
|---|
| TryLysC ESI |
|
|---|
| Try MALDI |
|
|---|
| ChTry MALDI |
|
|---|
| ArgC MALDI |
|
|---|
| LysN MALDI |
|
|---|
| TryLysC MALDI |
|
|---|
| Try LTQ |
|
|---|
| ChTry LTQ |
|
|---|
| ArgC LTQ |
|
|---|
| LysN LTQ |
|
|---|
| TryLysC LTQ |
|
|---|
| Try MSlow |
|
|---|
| ChTry MSlow |
|
|---|
| ArgC MSlow |
|
|---|
| LysN MSlow |
|
|---|
| TryLysC MSlow |
|
|---|
| Try MShigh |
|
|---|
| ChTry MShigh |
|
|---|
| ArgC MShigh |
|
|---|
| LysN MShigh |
|
|---|
| TryLysC MShigh |
|
|---|
General Statistics
Number of major isoforms |
Number of additional isoforms |
Number of all proteins |
Number of amino acids |
Min. Seq. Length |
Max. Seq. Length |
Avg. Seq. Length |
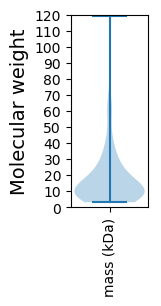
Avg. Mol. Weight |
|---|---|---|---|---|---|---|---|
0 |
18907 |
30 |
1176 |
167.3 |
18.29 |
Amino acid frequency
Ala |
Cys |
Asp |
Glu |
Phe |
Gly |
His |
Ile |
Lys |
Leu |
|---|---|---|---|---|---|---|---|---|---|
10.731 ± 0.382 | 1.402 ± 0.179 |
6.543 ± 0.23 | 5.95 ± 0.361 |
3.036 ± 0.173 | 8.938 ± 0.649 |
2.221 ± 0.184 | 4.337 ± 0.193 |
3.242 ± 0.206 | 7.32 ± 0.233 |
Met |
Asn |
Gln |
Pro |
Arg |
Ser |
Thr |
Val |
Trp |
Tyr |
|---|---|---|---|---|---|---|---|---|---|
2.253 ± 0.142 | 3.311 ± 0.179 |
5.977 ± 0.207 | 3.364 ± 0.204 |
6.934 ± 0.439 | 5.86 ± 0.297 |
6.574 ± 0.263 | 7.146 ± 0.308 |
2.322 ± 0.133 | 2.539 ± 0.144 |
Most of the basic statistics you can see at this page can be downloaded from this CSV file
See this proteome in:

Proteome-pI is available under Creative Commons Attribution-NoDerivs license, for more details see here
| Reference: Kozlowski LP. Proteome-pI 2.0: Proteome Isoelectric Point Database Update. Nucleic Acids Res. 2021, doi: 10.1093/nar/gkab944 | Contact: Lukasz P. Kozlowski |