Nocardia arthritidis
Taxonomy: cellular organisms; Bacteria; Terrabacteria group; Actinobacteria; Actinomycetia; Corynebacteriales; Nocardiaceae; Nocardia
Average proteome isoelectric point is 6.4
Get precalculated fractions of proteins
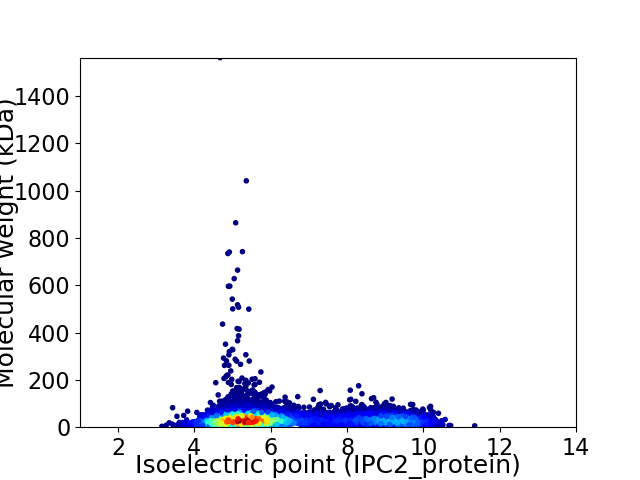
Virtual 2D-PAGE plot for 8970 proteins (isoelectric point calculated using IPC2_protein)
Get csv file with sequences according to given criteria:
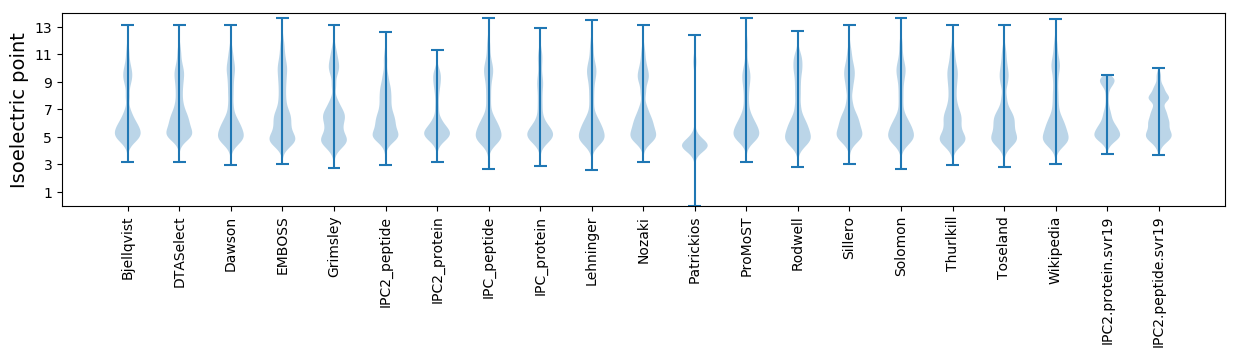
* You can choose from 21 different methods for calculating isoelectric point
Summary statistics related to proteome-wise predictions
Protein with the lowest isoelectric point:
>tr|A0A6G9YR97|A0A6G9YR97_9NOCA Transposase OS=Nocardia arthritidis OX=228602 GN=F5544_39045 PE=4 SV=1
MM1 pKa = 7.61EE2 pKa = 5.5NNLPALDD9 pKa = 3.82INALEE14 pKa = 4.14ISEE17 pKa = 4.62FLDD20 pKa = 4.06DD21 pKa = 5.35SRR23 pKa = 11.84MDD25 pKa = 3.84DD26 pKa = 3.4RR27 pKa = 11.84DD28 pKa = 3.61VVAKK32 pKa = 10.57VMSASCTTCEE42 pKa = 4.57CSCSCSSS49 pKa = 3.61
MM1 pKa = 7.61EE2 pKa = 5.5NNLPALDD9 pKa = 3.82INALEE14 pKa = 4.14ISEE17 pKa = 4.62FLDD20 pKa = 4.06DD21 pKa = 5.35SRR23 pKa = 11.84MDD25 pKa = 3.84DD26 pKa = 3.4RR27 pKa = 11.84DD28 pKa = 3.61VVAKK32 pKa = 10.57VMSASCTTCEE42 pKa = 4.57CSCSCSSS49 pKa = 3.61
Molecular weight: 5.32 kDa
Isoelectric point according different methods:
Protein with the highest isoelectric point:
>tr|A0A6G9Y4E1|A0A6G9Y4E1_9NOCA CBS domain-containing protein OS=Nocardia arthritidis OX=228602 GN=F5544_00155 PE=4 SV=1
MM1 pKa = 7.07LTVAKK6 pKa = 10.12GKK8 pKa = 8.71RR9 pKa = 11.84TFQPNNRR16 pKa = 11.84RR17 pKa = 11.84RR18 pKa = 11.84ARR20 pKa = 11.84VHH22 pKa = 5.99GFRR25 pKa = 11.84LRR27 pKa = 11.84MRR29 pKa = 11.84TRR31 pKa = 11.84AGRR34 pKa = 11.84AIVSARR40 pKa = 11.84RR41 pKa = 11.84RR42 pKa = 11.84KK43 pKa = 10.17GRR45 pKa = 11.84GTLTAA50 pKa = 4.78
MM1 pKa = 7.07LTVAKK6 pKa = 10.12GKK8 pKa = 8.71RR9 pKa = 11.84TFQPNNRR16 pKa = 11.84RR17 pKa = 11.84RR18 pKa = 11.84ARR20 pKa = 11.84VHH22 pKa = 5.99GFRR25 pKa = 11.84LRR27 pKa = 11.84MRR29 pKa = 11.84TRR31 pKa = 11.84AGRR34 pKa = 11.84AIVSARR40 pKa = 11.84RR41 pKa = 11.84RR42 pKa = 11.84KK43 pKa = 10.17GRR45 pKa = 11.84GTLTAA50 pKa = 4.78
Molecular weight: 5.79 kDa
Isoelectric point according different methods:
Peptides (in silico digests for buttom-up proteomics)
Below you can find in silico digests of the whole proteome with Trypsin, Chymotrypsin, Trypsin+LysC, LysN, ArgC proteases suitable for different mass spec machines.| Try ESI |
 |
|---|
| ChTry ESI |
|
|---|
| ArgC ESI |
|
|---|
| LysN ESI |
|
|---|
| TryLysC ESI |
|
|---|
| Try MALDI |
|
|---|
| ChTry MALDI |
|
|---|
| ArgC MALDI |
|
|---|
| LysN MALDI |
|
|---|
| TryLysC MALDI |
|
|---|
| Try LTQ |
|
|---|
| ChTry LTQ |
|
|---|
| ArgC LTQ |
|
|---|
| LysN LTQ |
|
|---|
| TryLysC LTQ |
|
|---|
| Try MSlow |
|
|---|
| ChTry MSlow |
|
|---|
| ArgC MSlow |
|
|---|
| LysN MSlow |
|
|---|
| TryLysC MSlow |
|
|---|
| Try MShigh |
|
|---|
| ChTry MShigh |
|
|---|
| ArgC MShigh |
|
|---|
| LysN MShigh |
|
|---|
| TryLysC MShigh |
|
|---|
General Statistics
Number of major isoforms |
Number of additional isoforms |
Number of all proteins |
Number of amino acids |
Min. Seq. Length |
Max. Seq. Length |
Avg. Seq. Length |
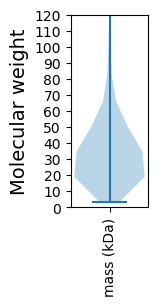
Avg. Mol. Weight |
|---|---|---|---|---|---|---|---|
0 |
3023542 |
29 |
14483 |
337.1 |
36.26 |
Amino acid frequency
Ala |
Cys |
Asp |
Glu |
Phe |
Gly |
His |
Ile |
Lys |
Leu |
|---|---|---|---|---|---|---|---|---|---|
13.325 ± 0.041 | 0.841 ± 0.008 |
6.107 ± 0.02 | 5.213 ± 0.026 |
2.988 ± 0.015 | 8.875 ± 0.024 |
2.237 ± 0.013 | 4.321 ± 0.017 |
1.94 ± 0.019 | 10.034 ± 0.031 |
Met |
Asn |
Gln |
Pro |
Arg |
Ser |
Thr |
Val |
Trp |
Tyr |
|---|---|---|---|---|---|---|---|---|---|
1.872 ± 0.01 | 2.137 ± 0.013 |
6.062 ± 0.024 | 2.84 ± 0.016 |
8.118 ± 0.026 | 5.167 ± 0.017 |
6.094 ± 0.02 | 8.187 ± 0.028 |
1.504 ± 0.01 | 2.139 ± 0.012 |
Most of the basic statistics you can see at this page can be downloaded from this CSV file
See this proteome in:

Proteome-pI is available under Creative Commons Attribution-NoDerivs license, for more details see here
| Reference: Kozlowski LP. Proteome-pI 2.0: Proteome Isoelectric Point Database Update. Nucleic Acids Res. 2021, doi: 10.1093/nar/gkab944 | Contact: Lukasz P. Kozlowski |