Gordonia phage MelBins
Taxonomy: Viruses; Duplodnaviria; Heunggongvirae; Uroviricota; Caudoviricetes; Caudovirales; Siphoviridae; unclassified Siphoviridae
Average proteome isoelectric point is 6.01
Get precalculated fractions of proteins
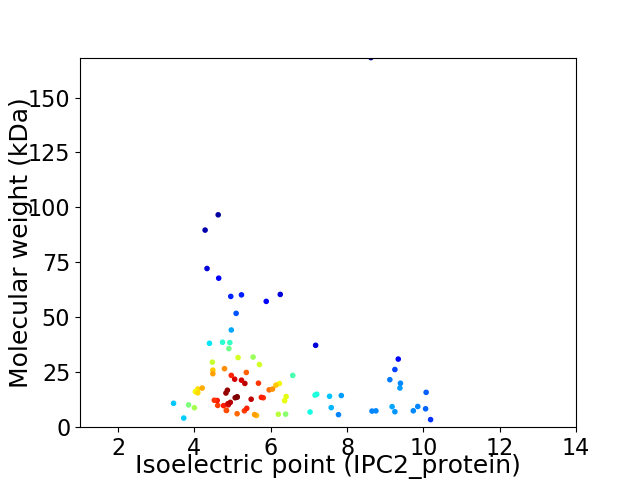
Virtual 2D-PAGE plot for 89 proteins (isoelectric point calculated using IPC2_protein)
Get csv file with sequences according to given criteria:
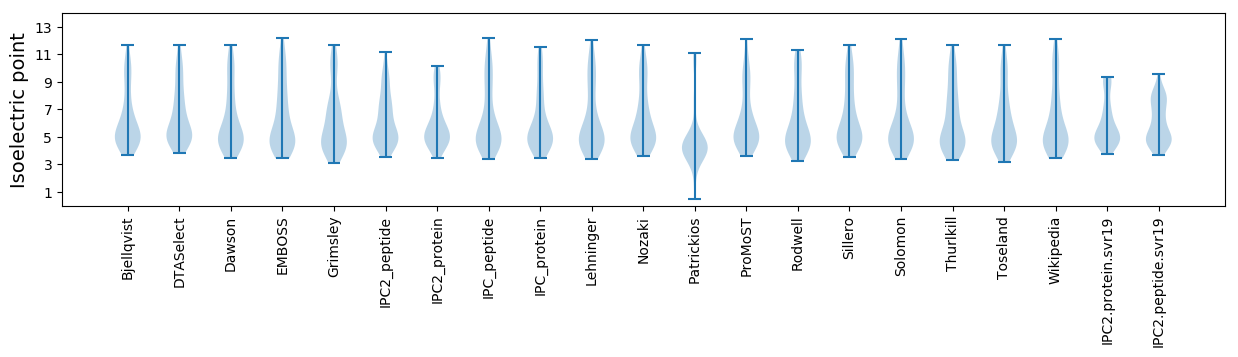
* You can choose from 21 different methods for calculating isoelectric point
Summary statistics related to proteome-wise predictions
Protein with the lowest isoelectric point:
>tr|A0A649VN15|A0A649VN15_9CAUD Crossover junction endodeoxyribonuclease RuvC OS=Gordonia phage MelBins OX=2656540 GN=67 PE=3 SV=1
MM1 pKa = 7.6IATDD5 pKa = 4.13ADD7 pKa = 3.71AALADD12 pKa = 3.9YY13 pKa = 7.68WTAKK17 pKa = 10.82ANGDD21 pKa = 3.54EE22 pKa = 4.39DD23 pKa = 4.28AADD26 pKa = 4.14AAHH29 pKa = 7.06LAYY32 pKa = 10.52VNAMYY37 pKa = 7.58ATPP40 pKa = 4.11
MM1 pKa = 7.6IATDD5 pKa = 4.13ADD7 pKa = 3.71AALADD12 pKa = 3.9YY13 pKa = 7.68WTAKK17 pKa = 10.82ANGDD21 pKa = 3.54EE22 pKa = 4.39DD23 pKa = 4.28AADD26 pKa = 4.14AAHH29 pKa = 7.06LAYY32 pKa = 10.52VNAMYY37 pKa = 7.58ATPP40 pKa = 4.11
Molecular weight: 4.16 kDa
Isoelectric point according different methods:
Protein with the highest isoelectric point:
>tr|A0A649VMX5|A0A649VMX5_9CAUD Uncharacterized protein OS=Gordonia phage MelBins OX=2656540 GN=27 PE=4 SV=1
MM1 pKa = 7.76IPRR4 pKa = 11.84DD5 pKa = 4.04QQPMPTPAEE14 pKa = 4.16AIEE17 pKa = 4.48AYY19 pKa = 9.78KK20 pKa = 10.48AGQVSRR26 pKa = 11.84PGAGNPYY33 pKa = 9.91AGRR36 pKa = 11.84RR37 pKa = 11.84VLGSVWALGNRR48 pKa = 11.84EE49 pKa = 4.17AQRR52 pKa = 11.84VAYY55 pKa = 9.34TEE57 pKa = 3.77MRR59 pKa = 11.84KK60 pKa = 9.54RR61 pKa = 11.84EE62 pKa = 3.95AARR65 pKa = 11.84RR66 pKa = 11.84EE67 pKa = 4.05
MM1 pKa = 7.76IPRR4 pKa = 11.84DD5 pKa = 4.04QQPMPTPAEE14 pKa = 4.16AIEE17 pKa = 4.48AYY19 pKa = 9.78KK20 pKa = 10.48AGQVSRR26 pKa = 11.84PGAGNPYY33 pKa = 9.91AGRR36 pKa = 11.84RR37 pKa = 11.84VLGSVWALGNRR48 pKa = 11.84EE49 pKa = 4.17AQRR52 pKa = 11.84VAYY55 pKa = 9.34TEE57 pKa = 3.77MRR59 pKa = 11.84KK60 pKa = 9.54RR61 pKa = 11.84EE62 pKa = 3.95AARR65 pKa = 11.84RR66 pKa = 11.84EE67 pKa = 4.05
Molecular weight: 7.47 kDa
Isoelectric point according different methods:
Peptides (in silico digests for buttom-up proteomics)
Below you can find in silico digests of the whole proteome with Trypsin, Chymotrypsin, Trypsin+LysC, LysN, ArgC proteases suitable for different mass spec machines.| Try ESI |
 |
|---|
| ChTry ESI |
|
|---|
| ArgC ESI |
|
|---|
| LysN ESI |
|
|---|
| TryLysC ESI |
|
|---|
| Try MALDI |
|
|---|
| ChTry MALDI |
|
|---|
| ArgC MALDI |
|
|---|
| LysN MALDI |
|
|---|
| TryLysC MALDI |
|
|---|
| Try LTQ |
|
|---|
| ChTry LTQ |
|
|---|
| ArgC LTQ |
|
|---|
| LysN LTQ |
|
|---|
| TryLysC LTQ |
|
|---|
| Try MSlow |
|
|---|
| ChTry MSlow |
|
|---|
| ArgC MSlow |
|
|---|
| LysN MSlow |
|
|---|
| TryLysC MSlow |
|
|---|
| Try MShigh |
|
|---|
| ChTry MShigh |
|
|---|
| ArgC MShigh |
|
|---|
| LysN MShigh |
|
|---|
| TryLysC MShigh |
|
|---|
General Statistics
Number of major isoforms |
Number of additional isoforms |
Number of all proteins |
Number of amino acids |
Min. Seq. Length |
Max. Seq. Length |
Avg. Seq. Length |
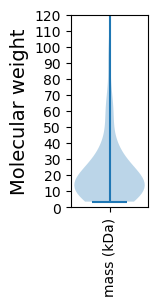
Avg. Mol. Weight |
|---|---|---|---|---|---|---|---|
0 |
19240 |
32 |
1630 |
216.2 |
23.51 |
Amino acid frequency
Ala |
Cys |
Asp |
Glu |
Phe |
Gly |
His |
Ile |
Lys |
Leu |
|---|---|---|---|---|---|---|---|---|---|
12.625 ± 0.524 | 1.008 ± 0.15 |
7.568 ± 0.386 | 5.447 ± 0.329 |
2.313 ± 0.222 | 8.165 ± 0.475 |
2.256 ± 0.199 | 4.241 ± 0.179 |
2.526 ± 0.194 | 7.708 ± 0.206 |
Met |
Asn |
Gln |
Pro |
Arg |
Ser |
Thr |
Val |
Trp |
Tyr |
|---|---|---|---|---|---|---|---|---|---|
2.318 ± 0.12 | 2.76 ± 0.152 |
6.398 ± 0.264 | 3.763 ± 0.139 |
7.536 ± 0.382 | 4.501 ± 0.236 |
6.907 ± 0.285 | 7.677 ± 0.192 |
2.131 ± 0.138 | 2.152 ± 0.126 |
Most of the basic statistics you can see at this page can be downloaded from this CSV file
See this proteome in:

Proteome-pI is available under Creative Commons Attribution-NoDerivs license, for more details see here
| Reference: Kozlowski LP. Proteome-pI 2.0: Proteome Isoelectric Point Database Update. Nucleic Acids Res. 2021, doi: 10.1093/nar/gkab944 | Contact: Lukasz P. Kozlowski |