Buchnera aphidicola (Nipponaphis monzeni)
Taxonomy: cellular organisms; Bacteria; Proteobacteria; Gammaproteobacteria; Enterobacterales; Erwiniaceae; Buchnera; Buchnera aphidicola
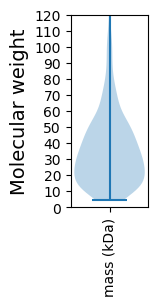
Average proteome isoelectric point is 8.62
Get precalculated fractions of proteins

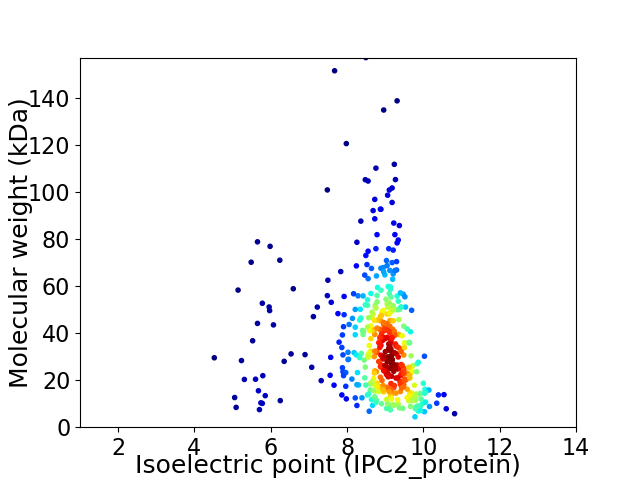
Virtual 2D-PAGE plot for 441 proteins (isoelectric point calculated using IPC2_protein)
Get csv file with sequences according to given criteria:
* You can choose from 21 different methods for calculating isoelectric point
Summary statistics related to proteome-wise predictions


Protein with the lowest isoelectric point:
>tr|A0A455TA08|A0A455TA08_9GAMM NADH-quinone oxidoreductase subunit N OS=Buchnera aphidicola (Nipponaphis monzeni) OX=2495405 GN=nuoN PE=3 SV=1
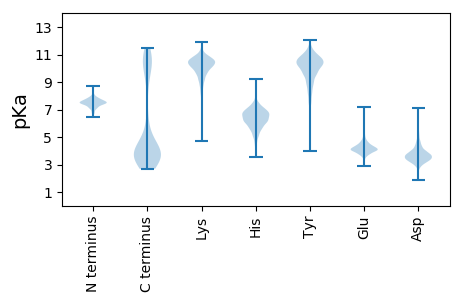
MM1 pKa = 7.31KK2 pKa = 10.05PEE4 pKa = 3.88EE5 pKa = 4.11KK6 pKa = 10.71ALIEE10 pKa = 4.44SLFNRR15 pKa = 11.84LKK17 pKa = 10.82VIEE20 pKa = 4.37EE21 pKa = 3.97KK22 pKa = 10.84FPNRR26 pKa = 11.84NRR28 pKa = 11.84LVSEE32 pKa = 4.5YY33 pKa = 10.31ISSLVKK39 pKa = 10.39NQPNSIYY46 pKa = 10.74YY47 pKa = 9.63IAQTTLIQEE56 pKa = 4.27VAIKK60 pKa = 10.38KK61 pKa = 9.55LNKK64 pKa = 9.7KK65 pKa = 9.48ILYY68 pKa = 9.28LEE70 pKa = 4.44KK71 pKa = 10.45KK72 pKa = 10.1ISDD75 pKa = 4.67LISQKK80 pKa = 7.54NHH82 pKa = 6.81KK83 pKa = 9.36EE84 pKa = 3.72PSFLSSLFGSSKK96 pKa = 10.38KK97 pKa = 10.34SKK99 pKa = 8.81KK100 pKa = 7.22TQNFEE105 pKa = 4.24NNNFEE110 pKa = 4.08TSAIPNSGNNNLKK123 pKa = 10.41ALNNSSPVSSLGNSFIGNALQTAAGVAGGIVVGNMLMNLFHH164 pKa = 7.26KK165 pKa = 10.28DD166 pKa = 3.21KK167 pKa = 10.76PEE169 pKa = 3.71EE170 pKa = 4.28EE171 pKa = 4.18IFDD174 pKa = 4.66TIQEE178 pKa = 4.33DD179 pKa = 3.96ATFSNLEE186 pKa = 4.13SYY188 pKa = 11.11DD189 pKa = 4.02FNNKK193 pKa = 9.44DD194 pKa = 3.29QFLSTSEE201 pKa = 4.21DD202 pKa = 3.5FLVNHH207 pKa = 7.62DD208 pKa = 4.45DD209 pKa = 3.72SQLNSVTEE217 pKa = 4.12TLDD220 pKa = 3.44QEE222 pKa = 4.51ILEE225 pKa = 4.72TEE227 pKa = 3.94HH228 pKa = 6.83DD229 pKa = 4.09TNNVIDD235 pKa = 3.84NQYY238 pKa = 11.23YY239 pKa = 10.61DD240 pKa = 5.36DD241 pKa = 4.58SDD243 pKa = 4.0NNSFDD248 pKa = 3.71NATLDD253 pKa = 6.12DD254 pKa = 4.23IDD256 pKa = 5.53DD257 pKa = 4.65DD258 pKa = 4.57NFII261 pKa = 5.11
MM1 pKa = 7.31KK2 pKa = 10.05PEE4 pKa = 3.88EE5 pKa = 4.11KK6 pKa = 10.71ALIEE10 pKa = 4.44SLFNRR15 pKa = 11.84LKK17 pKa = 10.82VIEE20 pKa = 4.37EE21 pKa = 3.97KK22 pKa = 10.84FPNRR26 pKa = 11.84NRR28 pKa = 11.84LVSEE32 pKa = 4.5YY33 pKa = 10.31ISSLVKK39 pKa = 10.39NQPNSIYY46 pKa = 10.74YY47 pKa = 9.63IAQTTLIQEE56 pKa = 4.27VAIKK60 pKa = 10.38KK61 pKa = 9.55LNKK64 pKa = 9.7KK65 pKa = 9.48ILYY68 pKa = 9.28LEE70 pKa = 4.44KK71 pKa = 10.45KK72 pKa = 10.1ISDD75 pKa = 4.67LISQKK80 pKa = 7.54NHH82 pKa = 6.81KK83 pKa = 9.36EE84 pKa = 3.72PSFLSSLFGSSKK96 pKa = 10.38KK97 pKa = 10.34SKK99 pKa = 8.81KK100 pKa = 7.22TQNFEE105 pKa = 4.24NNNFEE110 pKa = 4.08TSAIPNSGNNNLKK123 pKa = 10.41ALNNSSPVSSLGNSFIGNALQTAAGVAGGIVVGNMLMNLFHH164 pKa = 7.26KK165 pKa = 10.28DD166 pKa = 3.21KK167 pKa = 10.76PEE169 pKa = 3.71EE170 pKa = 4.28EE171 pKa = 4.18IFDD174 pKa = 4.66TIQEE178 pKa = 4.33DD179 pKa = 3.96ATFSNLEE186 pKa = 4.13SYY188 pKa = 11.11DD189 pKa = 4.02FNNKK193 pKa = 9.44DD194 pKa = 3.29QFLSTSEE201 pKa = 4.21DD202 pKa = 3.5FLVNHH207 pKa = 7.62DD208 pKa = 4.45DD209 pKa = 3.72SQLNSVTEE217 pKa = 4.12TLDD220 pKa = 3.44QEE222 pKa = 4.51ILEE225 pKa = 4.72TEE227 pKa = 3.94HH228 pKa = 6.83DD229 pKa = 4.09TNNVIDD235 pKa = 3.84NQYY238 pKa = 11.23YY239 pKa = 10.61DD240 pKa = 5.36DD241 pKa = 4.58SDD243 pKa = 4.0NNSFDD248 pKa = 3.71NATLDD253 pKa = 6.12DD254 pKa = 4.23IDD256 pKa = 5.53DD257 pKa = 4.65DD258 pKa = 4.57NFII261 pKa = 5.11
Molecular weight: 29.51 kDa
Isoelectric point according different methods:
Protein with the highest isoelectric point:
>tr|A0A455TAQ2|A0A455TAQ2_9GAMM Pyridoxal phosphate homeostasis protein OS=Buchnera aphidicola (Nipponaphis monzeni) OX=2495405 GN=yggS PE=3 SV=1
MM1 pKa = 7.06STINQLVRR9 pKa = 11.84KK10 pKa = 9.64SRR12 pKa = 11.84IKK14 pKa = 10.51KK15 pKa = 9.17IIKK18 pKa = 9.96SSVPALEE25 pKa = 4.25SCPQKK30 pKa = 10.56RR31 pKa = 11.84GVCIKK36 pKa = 10.8VYY38 pKa = 7.65TTTPKK43 pKa = 10.53KK44 pKa = 10.26PNSALRR50 pKa = 11.84KK51 pKa = 7.38VCRR54 pKa = 11.84VRR56 pKa = 11.84LTNGFEE62 pKa = 3.93VTSYY66 pKa = 10.74IGGEE70 pKa = 3.94GHH72 pKa = 6.6NLQEE76 pKa = 4.47HH77 pKa = 5.28SVILIRR83 pKa = 11.84GGRR86 pKa = 11.84VKK88 pKa = 10.7DD89 pKa = 3.73LPGVRR94 pKa = 11.84YY95 pKa = 9.07HH96 pKa = 7.16VIRR99 pKa = 11.84GSLDD103 pKa = 3.24CAGVKK108 pKa = 9.52DD109 pKa = 4.26RR110 pKa = 11.84KK111 pKa = 10.17NGRR114 pKa = 11.84SKK116 pKa = 11.31YY117 pKa = 9.07GVKK120 pKa = 10.12KK121 pKa = 10.65VRR123 pKa = 11.84SS124 pKa = 3.65
MM1 pKa = 7.06STINQLVRR9 pKa = 11.84KK10 pKa = 9.64SRR12 pKa = 11.84IKK14 pKa = 10.51KK15 pKa = 9.17IIKK18 pKa = 9.96SSVPALEE25 pKa = 4.25SCPQKK30 pKa = 10.56RR31 pKa = 11.84GVCIKK36 pKa = 10.8VYY38 pKa = 7.65TTTPKK43 pKa = 10.53KK44 pKa = 10.26PNSALRR50 pKa = 11.84KK51 pKa = 7.38VCRR54 pKa = 11.84VRR56 pKa = 11.84LTNGFEE62 pKa = 3.93VTSYY66 pKa = 10.74IGGEE70 pKa = 3.94GHH72 pKa = 6.6NLQEE76 pKa = 4.47HH77 pKa = 5.28SVILIRR83 pKa = 11.84GGRR86 pKa = 11.84VKK88 pKa = 10.7DD89 pKa = 3.73LPGVRR94 pKa = 11.84YY95 pKa = 9.07HH96 pKa = 7.16VIRR99 pKa = 11.84GSLDD103 pKa = 3.24CAGVKK108 pKa = 9.52DD109 pKa = 4.26RR110 pKa = 11.84KK111 pKa = 10.17NGRR114 pKa = 11.84SKK116 pKa = 11.31YY117 pKa = 9.07GVKK120 pKa = 10.12KK121 pKa = 10.65VRR123 pKa = 11.84SS124 pKa = 3.65
Molecular weight: 13.8 kDa
Isoelectric point according different methods:
Peptides (in silico digests for buttom-up proteomics)
Below you can find in silico digests of the whole proteome with Trypsin, Chymotrypsin, Trypsin+LysC, LysN, ArgC proteases suitable for different mass spec machines.| Try ESI |
 |
|---|
| ChTry ESI |
 |
|---|
| ArgC ESI |
 |
|---|
| LysN ESI |
 |
|---|
| TryLysC ESI |
 |
|---|
| Try MALDI |
 |
|---|
| ChTry MALDI |
 |
|---|
| ArgC MALDI |
 |
|---|
| LysN MALDI |
 |
|---|
| TryLysC MALDI |
 |
|---|
| Try LTQ |
 |
|---|
| ChTry LTQ |
 |
|---|
| ArgC LTQ |
 |
|---|
| LysN LTQ |
 |
|---|
| TryLysC LTQ |
 |
|---|
| Try MSlow |
 |
|---|
| ChTry MSlow |
 |
|---|
| ArgC MSlow |
 |
|---|
| LysN MSlow |
 |
|---|
| TryLysC MSlow |
 |
|---|
| Try MShigh |
 |
|---|
| ChTry MShigh |
 |
|---|
| ArgC MShigh |
 |
|---|
| LysN MShigh |
 |
|---|
| TryLysC MShigh |
 |
|---|
General Statistics
Number of major isoforms |
Number of additional isoforms |
Number of all proteins |
Number of amino acids |
Min. Seq. Length |
Max. Seq. Length |
Avg. Seq. Length |
Avg. Mol. Weight |
|---|---|---|---|---|---|---|---|
0 |
142382 |
38 |
1405 |
322.9 |
36.93 |
Amino acid frequency
Ala |
Cys |
Asp |
Glu |
Phe |
Gly |
His |
Ile |
Lys |
Leu |
|---|---|---|---|---|---|---|---|---|---|
4.093 ± 0.088 | 1.393 ± 0.035 |
3.71 ± 0.072 | 4.46 ± 0.102 |
4.836 ± 0.097 | 5.226 ± 0.107 |
2.18 ± 0.052 | 12.272 ± 0.128 |
10.228 ± 0.133 | 10.048 ± 0.118 |
Met |
Asn |
Gln |
Pro |
Arg |
Ser |
Thr |
Val |
Trp |
Tyr |
|---|---|---|---|---|---|---|---|---|---|
2.203 ± 0.046 | 8.06 ± 0.105 |
3.02 ± 0.06 | 3.422 ± 0.051 |
3.278 ± 0.082 | 6.753 ± 0.072 |
4.947 ± 0.065 | 5.014 ± 0.082 |
0.901 ± 0.044 | 3.956 ± 0.072 |
Most of the basic statistics you can see at this page can be downloaded from this CSV file
Proteome-pI is available under Creative Commons Attribution-NoDerivs license, for more details see here
| Reference: Kozlowski LP. Proteome-pI 2.0: Proteome Isoelectric Point Database Update. Nucleic Acids Res. 2021, doi: 10.1093/nar/gkab944 | Contact: Lukasz P. Kozlowski |
