Lactobacillus phage KC5a
Taxonomy: Viruses; Duplodnaviria; Heunggongvirae; Uroviricota; Caudoviricetes; Caudovirales; Myoviridae; unclassified Myoviridae
Average proteome isoelectric point is 6.36
Get precalculated fractions of proteins
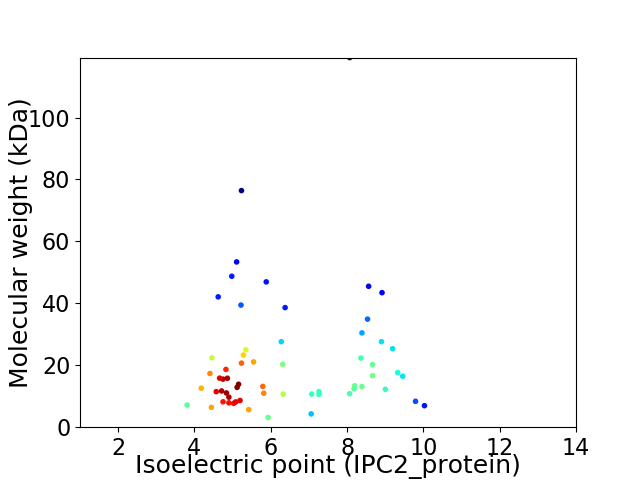
Virtual 2D-PAGE plot for 61 proteins (isoelectric point calculated using IPC2_protein)
Get csv file with sequences according to given criteria:
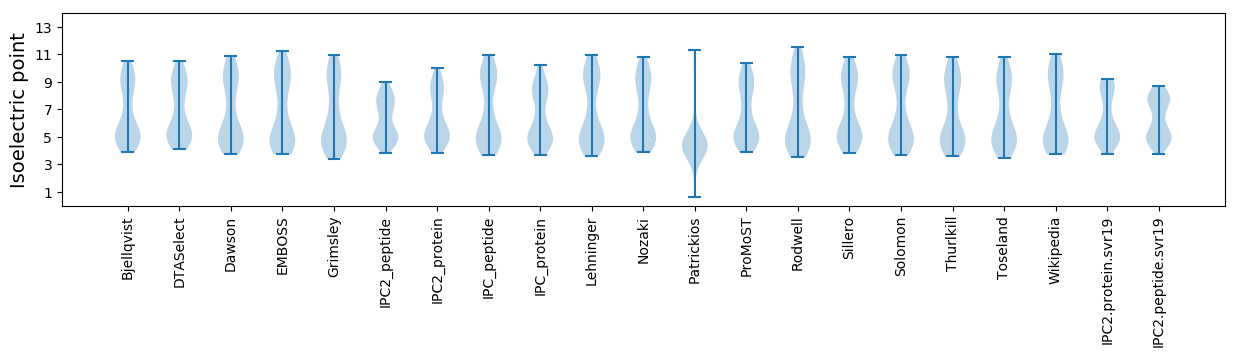
* You can choose from 21 different methods for calculating isoelectric point
Summary statistics related to proteome-wise predictions
Protein with the lowest isoelectric point:
>tr|Q20DB7|Q20DB7_9CAUD Uncharacterized protein orf56 OS=Lactobacillus phage KC5a OX=363555 GN=orf56 PE=4 SV=1
MM1 pKa = 7.74FDD3 pKa = 4.24FDD5 pKa = 4.79FSSIYY10 pKa = 10.98SNLEE14 pKa = 3.97SLCKK18 pKa = 10.25SSLDD22 pKa = 3.29NGYY25 pKa = 8.06FTDD28 pKa = 3.58STIAGFVEE36 pKa = 4.4QGTFDD41 pKa = 3.26AAGYY45 pKa = 10.18KK46 pKa = 10.18RR47 pKa = 11.84ITGDD51 pKa = 3.76DD52 pKa = 3.79YY53 pKa = 11.96VAGNQTTVANSQAA66 pKa = 3.28
MM1 pKa = 7.74FDD3 pKa = 4.24FDD5 pKa = 4.79FSSIYY10 pKa = 10.98SNLEE14 pKa = 3.97SLCKK18 pKa = 10.25SSLDD22 pKa = 3.29NGYY25 pKa = 8.06FTDD28 pKa = 3.58STIAGFVEE36 pKa = 4.4QGTFDD41 pKa = 3.26AAGYY45 pKa = 10.18KK46 pKa = 10.18RR47 pKa = 11.84ITGDD51 pKa = 3.76DD52 pKa = 3.79YY53 pKa = 11.96VAGNQTTVANSQAA66 pKa = 3.28
Molecular weight: 7.15 kDa
Isoelectric point according different methods:
Protein with the highest isoelectric point:
>tr|Q20DE2|Q20DE2_9CAUD Uncharacterized protein orf31 OS=Lactobacillus phage KC5a OX=363555 GN=orf31 PE=4 SV=1
MM1 pKa = 7.05MGKK4 pKa = 9.8IINFIMTSRR13 pKa = 11.84KK14 pKa = 9.63ASSFFMKK21 pKa = 10.75AFMKK25 pKa = 10.35FLAVVLKK32 pKa = 9.19YY33 pKa = 10.74LPLLDD38 pKa = 4.66LVSLNLYY45 pKa = 9.87SSQRR49 pKa = 11.84INPIISKK56 pKa = 10.49LIFLL60 pKa = 4.9
MM1 pKa = 7.05MGKK4 pKa = 9.8IINFIMTSRR13 pKa = 11.84KK14 pKa = 9.63ASSFFMKK21 pKa = 10.75AFMKK25 pKa = 10.35FLAVVLKK32 pKa = 9.19YY33 pKa = 10.74LPLLDD38 pKa = 4.66LVSLNLYY45 pKa = 9.87SSQRR49 pKa = 11.84INPIISKK56 pKa = 10.49LIFLL60 pKa = 4.9
Molecular weight: 6.95 kDa
Isoelectric point according different methods:
Peptides (in silico digests for buttom-up proteomics)
Below you can find in silico digests of the whole proteome with Trypsin, Chymotrypsin, Trypsin+LysC, LysN, ArgC proteases suitable for different mass spec machines.| Try ESI |
 |
|---|
| ChTry ESI |
|
|---|
| ArgC ESI |
|
|---|
| LysN ESI |
|
|---|
| TryLysC ESI |
|
|---|
| Try MALDI |
|
|---|
| ChTry MALDI |
|
|---|
| ArgC MALDI |
|
|---|
| LysN MALDI |
|
|---|
| TryLysC MALDI |
|
|---|
| Try LTQ |
|
|---|
| ChTry LTQ |
|
|---|
| ArgC LTQ |
|
|---|
| LysN LTQ |
|
|---|
| TryLysC LTQ |
|
|---|
| Try MSlow |
|
|---|
| ChTry MSlow |
|
|---|
| ArgC MSlow |
|
|---|
| LysN MSlow |
|
|---|
| TryLysC MSlow |
|
|---|
| Try MShigh |
|
|---|
| ChTry MShigh |
|
|---|
| ArgC MShigh |
|
|---|
| LysN MShigh |
|
|---|
| TryLysC MShigh |
|
|---|
General Statistics
Number of major isoforms |
Number of additional isoforms |
Number of all proteins |
Number of amino acids |
Min. Seq. Length |
Max. Seq. Length |
Avg. Seq. Length |
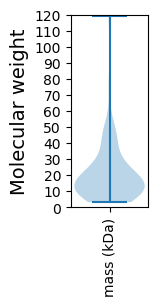
Avg. Mol. Weight |
|---|---|---|---|---|---|---|---|
0 |
11619 |
28 |
1184 |
190.5 |
21.39 |
Amino acid frequency
Ala |
Cys |
Asp |
Glu |
Phe |
Gly |
His |
Ile |
Lys |
Leu |
|---|---|---|---|---|---|---|---|---|---|
7.445 ± 0.776 | 0.697 ± 0.122 |
7.006 ± 0.308 | 6.059 ± 0.471 |
3.52 ± 0.172 | 6.412 ± 0.578 |
1.274 ± 0.156 | 6.558 ± 0.295 |
8.555 ± 0.457 | 8.486 ± 0.401 |
Met |
Asn |
Gln |
Pro |
Arg |
Ser |
Thr |
Val |
Trp |
Tyr |
|---|---|---|---|---|---|---|---|---|---|
2.642 ± 0.286 | 6.154 ± 0.406 |
3.064 ± 0.227 | 3.864 ± 0.193 |
3.95 ± 0.342 | 6.137 ± 0.228 |
6.197 ± 0.387 | 6.748 ± 0.382 |
1.257 ± 0.152 | 3.976 ± 0.387 |
Most of the basic statistics you can see at this page can be downloaded from this CSV file
See this proteome in:

Proteome-pI is available under Creative Commons Attribution-NoDerivs license, for more details see here
| Reference: Kozlowski LP. Proteome-pI 2.0: Proteome Isoelectric Point Database Update. Nucleic Acids Res. 2021, doi: 10.1093/nar/gkab944 | Contact: Lukasz P. Kozlowski |