Metabacillus indicus (Bacillus indicus)
Taxonomy: cellular organisms; Bacteria; Terrabacteria group; Firmicutes; Bacilli; Bacillales; Bacillaceae; Metabacillus
Average proteome isoelectric point is 6.22
Get precalculated fractions of proteins
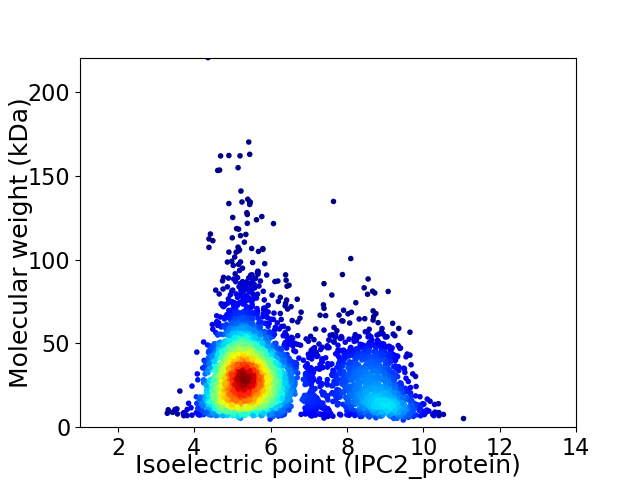
Virtual 2D-PAGE plot for 3781 proteins (isoelectric point calculated using IPC2_protein)
Get csv file with sequences according to given criteria:
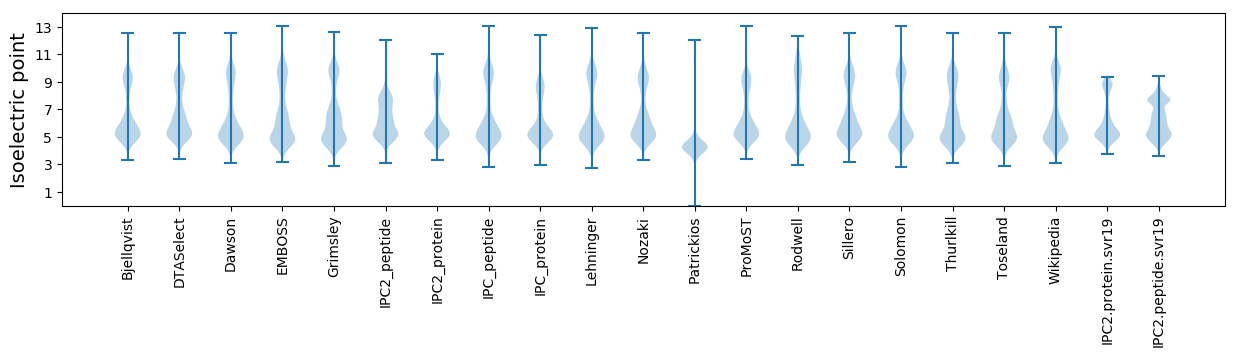
* You can choose from 21 different methods for calculating isoelectric point
Summary statistics related to proteome-wise predictions
Protein with the lowest isoelectric point:
>tr|A0A084GX46|A0A084GX46_METID Sporulation protein OS=Metabacillus indicus OX=246786 GN=GS18_0212455 PE=4 SV=1
MM1 pKa = 7.48TSLSGNSGIFTGTNTQYY18 pKa = 11.63DD19 pKa = 3.79WTVSMKK25 pKa = 10.67SNYY28 pKa = 9.91GFGKK32 pKa = 10.41IMGANNLAVDD42 pKa = 4.5TVNIIHH48 pKa = 7.72DD49 pKa = 4.66DD50 pKa = 3.82DD51 pKa = 6.05FMDD54 pKa = 5.58SDD56 pKa = 4.33FTQNQGSNDD65 pKa = 3.44QPVYY69 pKa = 10.7QSS71 pKa = 3.04
MM1 pKa = 7.48TSLSGNSGIFTGTNTQYY18 pKa = 11.63DD19 pKa = 3.79WTVSMKK25 pKa = 10.67SNYY28 pKa = 9.91GFGKK32 pKa = 10.41IMGANNLAVDD42 pKa = 4.5TVNIIHH48 pKa = 7.72DD49 pKa = 4.66DD50 pKa = 3.82DD51 pKa = 6.05FMDD54 pKa = 5.58SDD56 pKa = 4.33FTQNQGSNDD65 pKa = 3.44QPVYY69 pKa = 10.7QSS71 pKa = 3.04
Molecular weight: 7.79 kDa
Isoelectric point according different methods:
Protein with the highest isoelectric point:
>tr|A0A084GNG4|A0A084GNG4_METID Sporulation initiation inhibitor Soj OS=Metabacillus indicus OX=246786 GN=GS18_0215760 PE=4 SV=1
MM1 pKa = 7.35KK2 pKa = 9.43RR3 pKa = 11.84TYY5 pKa = 10.21QPNNRR10 pKa = 11.84KK11 pKa = 9.13HH12 pKa = 6.54SKK14 pKa = 8.73VHH16 pKa = 5.66GFRR19 pKa = 11.84ARR21 pKa = 11.84MSSKK25 pKa = 10.48NGRR28 pKa = 11.84KK29 pKa = 9.07VLAARR34 pKa = 11.84RR35 pKa = 11.84RR36 pKa = 11.84KK37 pKa = 8.81GRR39 pKa = 11.84KK40 pKa = 8.75VLSAA44 pKa = 4.05
MM1 pKa = 7.35KK2 pKa = 9.43RR3 pKa = 11.84TYY5 pKa = 10.21QPNNRR10 pKa = 11.84KK11 pKa = 9.13HH12 pKa = 6.54SKK14 pKa = 8.73VHH16 pKa = 5.66GFRR19 pKa = 11.84ARR21 pKa = 11.84MSSKK25 pKa = 10.48NGRR28 pKa = 11.84KK29 pKa = 9.07VLAARR34 pKa = 11.84RR35 pKa = 11.84RR36 pKa = 11.84KK37 pKa = 8.81GRR39 pKa = 11.84KK40 pKa = 8.75VLSAA44 pKa = 4.05
Molecular weight: 5.16 kDa
Isoelectric point according different methods:
Peptides (in silico digests for buttom-up proteomics)
Below you can find in silico digests of the whole proteome with Trypsin, Chymotrypsin, Trypsin+LysC, LysN, ArgC proteases suitable for different mass spec machines.| Try ESI |
 |
|---|
| ChTry ESI |
|
|---|
| ArgC ESI |
|
|---|
| LysN ESI |
|
|---|
| TryLysC ESI |
|
|---|
| Try MALDI |
|
|---|
| ChTry MALDI |
|
|---|
| ArgC MALDI |
|
|---|
| LysN MALDI |
|
|---|
| TryLysC MALDI |
|
|---|
| Try LTQ |
|
|---|
| ChTry LTQ |
|
|---|
| ArgC LTQ |
|
|---|
| LysN LTQ |
|
|---|
| TryLysC LTQ |
|
|---|
| Try MSlow |
|
|---|
| ChTry MSlow |
|
|---|
| ArgC MSlow |
|
|---|
| LysN MSlow |
|
|---|
| TryLysC MSlow |
|
|---|
| Try MShigh |
|
|---|
| ChTry MShigh |
|
|---|
| ArgC MShigh |
|
|---|
| LysN MShigh |
|
|---|
| TryLysC MShigh |
|
|---|
General Statistics
Number of major isoforms |
Number of additional isoforms |
Number of all proteins |
Number of amino acids |
Min. Seq. Length |
Max. Seq. Length |
Avg. Seq. Length |
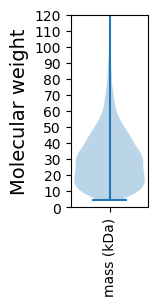
Avg. Mol. Weight |
|---|---|---|---|---|---|---|---|
0 |
1086472 |
37 |
2007 |
287.4 |
32.1 |
Amino acid frequency
Ala |
Cys |
Asp |
Glu |
Phe |
Gly |
His |
Ile |
Lys |
Leu |
|---|---|---|---|---|---|---|---|---|---|
7.878 ± 0.043 | 0.693 ± 0.012 |
5.146 ± 0.028 | 7.735 ± 0.051 |
4.579 ± 0.029 | 7.161 ± 0.035 |
2.119 ± 0.019 | 7.201 ± 0.041 |
6.944 ± 0.037 | 9.908 ± 0.046 |
Met |
Asn |
Gln |
Pro |
Arg |
Ser |
Thr |
Val |
Trp |
Tyr |
|---|---|---|---|---|---|---|---|---|---|
2.877 ± 0.019 | 3.839 ± 0.025 |
3.641 ± 0.023 | 3.509 ± 0.028 |
4.087 ± 0.032 | 6.252 ± 0.031 |
5.222 ± 0.023 | 6.812 ± 0.033 |
0.981 ± 0.014 | 3.417 ± 0.021 |
Most of the basic statistics you can see at this page can be downloaded from this CSV file
See this proteome in:

Proteome-pI is available under Creative Commons Attribution-NoDerivs license, for more details see here
| Reference: Kozlowski LP. Proteome-pI 2.0: Proteome Isoelectric Point Database Update. Nucleic Acids Res. 2021, doi: 10.1093/nar/gkab944 | Contact: Lukasz P. Kozlowski |