Novosphingobium barchaimii
Taxonomy: cellular organisms; Bacteria; Proteobacteria; Alphaproteobacteria; Sphingomonadales; Sphingomonadaceae; Novosphingobium
Average proteome isoelectric point is 6.59
Get precalculated fractions of proteins
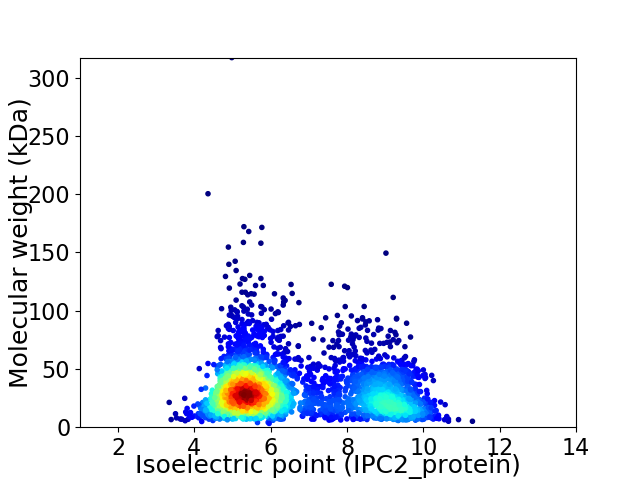
Virtual 2D-PAGE plot for 3126 proteins (isoelectric point calculated using IPC2_protein)
Get csv file with sequences according to given criteria:
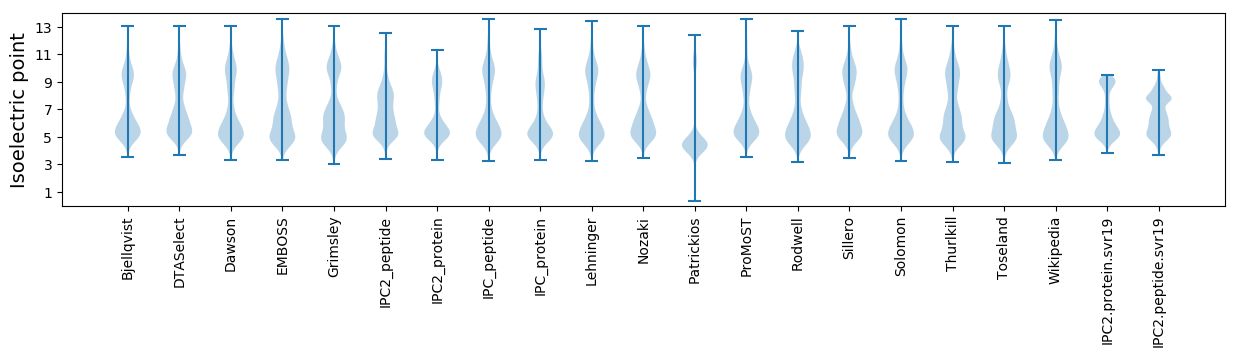
* You can choose from 21 different methods for calculating isoelectric point
Summary statistics related to proteome-wise predictions
Protein with the lowest isoelectric point:
>tr|A0A147ELI9|A0A147ELI9_9SPHN Cobalamin biosynthesis protein CobW OS=Novosphingobium barchaimii OX=1420591 GN=NS277_02680 PE=3 SV=1
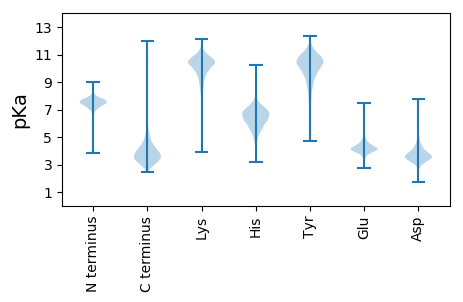
MM1 pKa = 7.43RR2 pKa = 11.84TTFEE6 pKa = 3.98EE7 pKa = 4.41ASVRR11 pKa = 11.84LYY13 pKa = 11.01HH14 pKa = 7.38LDD16 pKa = 3.6DD17 pKa = 5.04AGEE20 pKa = 4.49GGAATTLFYY29 pKa = 11.31GPLSEE34 pKa = 4.94ALAIAAAQDD43 pKa = 3.42EE44 pKa = 4.52ATQDD48 pKa = 3.98GLWIATDD55 pKa = 3.54NDD57 pKa = 3.6VIAYY61 pKa = 10.14LDD63 pKa = 3.96LDD65 pKa = 3.89SS66 pKa = 4.97
MM1 pKa = 7.43RR2 pKa = 11.84TTFEE6 pKa = 3.98EE7 pKa = 4.41ASVRR11 pKa = 11.84LYY13 pKa = 11.01HH14 pKa = 7.38LDD16 pKa = 3.6DD17 pKa = 5.04AGEE20 pKa = 4.49GGAATTLFYY29 pKa = 11.31GPLSEE34 pKa = 4.94ALAIAAAQDD43 pKa = 3.42EE44 pKa = 4.52ATQDD48 pKa = 3.98GLWIATDD55 pKa = 3.54NDD57 pKa = 3.6VIAYY61 pKa = 10.14LDD63 pKa = 3.96LDD65 pKa = 3.89SS66 pKa = 4.97
Molecular weight: 7.05 kDa
Isoelectric point according different methods:
Protein with the highest isoelectric point:
>tr|A0A147EL05|A0A147EL05_9SPHN RNA polymerase sigma factor RpoH OS=Novosphingobium barchaimii OX=1420591 GN=rpoH PE=3 SV=1
MM1 pKa = 7.45KK2 pKa = 9.61RR3 pKa = 11.84TFQPSNLVRR12 pKa = 11.84ARR14 pKa = 11.84RR15 pKa = 11.84HH16 pKa = 4.45GFRR19 pKa = 11.84ARR21 pKa = 11.84TATVGGRR28 pKa = 11.84KK29 pKa = 8.17VLRR32 pKa = 11.84ARR34 pKa = 11.84RR35 pKa = 11.84ARR37 pKa = 11.84GRR39 pKa = 11.84KK40 pKa = 9.02KK41 pKa = 10.61LSAA44 pKa = 4.03
MM1 pKa = 7.45KK2 pKa = 9.61RR3 pKa = 11.84TFQPSNLVRR12 pKa = 11.84ARR14 pKa = 11.84RR15 pKa = 11.84HH16 pKa = 4.45GFRR19 pKa = 11.84ARR21 pKa = 11.84TATVGGRR28 pKa = 11.84KK29 pKa = 8.17VLRR32 pKa = 11.84ARR34 pKa = 11.84RR35 pKa = 11.84ARR37 pKa = 11.84GRR39 pKa = 11.84KK40 pKa = 9.02KK41 pKa = 10.61LSAA44 pKa = 4.03
Molecular weight: 5.08 kDa
Isoelectric point according different methods:
Peptides (in silico digests for buttom-up proteomics)
Below you can find in silico digests of the whole proteome with Trypsin, Chymotrypsin, Trypsin+LysC, LysN, ArgC proteases suitable for different mass spec machines.| Try ESI |
 |
|---|
| ChTry ESI |
|
|---|
| ArgC ESI |
|
|---|
| LysN ESI |
|
|---|
| TryLysC ESI |
|
|---|
| Try MALDI |
|
|---|
| ChTry MALDI |
|
|---|
| ArgC MALDI |
|
|---|
| LysN MALDI |
|
|---|
| TryLysC MALDI |
|
|---|
| Try LTQ |
|
|---|
| ChTry LTQ |
|
|---|
| ArgC LTQ |
|
|---|
| LysN LTQ |
|
|---|
| TryLysC LTQ |
|
|---|
| Try MSlow |
|
|---|
| ChTry MSlow |
|
|---|
| ArgC MSlow |
|
|---|
| LysN MSlow |
|
|---|
| TryLysC MSlow |
|
|---|
| Try MShigh |
|
|---|
| ChTry MShigh |
|
|---|
| ArgC MShigh |
|
|---|
| LysN MShigh |
|
|---|
| TryLysC MShigh |
|
|---|
General Statistics
Number of major isoforms |
Number of additional isoforms |
Number of all proteins |
Number of amino acids |
Min. Seq. Length |
Max. Seq. Length |
Avg. Seq. Length |
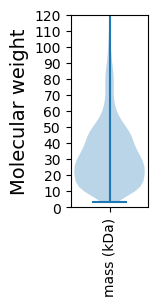
Avg. Mol. Weight |
|---|---|---|---|---|---|---|---|
0 |
995628 |
29 |
3219 |
318.5 |
34.43 |
Amino acid frequency
Ala |
Cys |
Asp |
Glu |
Phe |
Gly |
His |
Ile |
Lys |
Leu |
|---|---|---|---|---|---|---|---|---|---|
12.983 ± 0.067 | 0.795 ± 0.013 |
5.843 ± 0.039 | 5.341 ± 0.041 |
3.522 ± 0.03 | 8.869 ± 0.045 |
1.998 ± 0.023 | 5.044 ± 0.032 |
3.059 ± 0.032 | 9.972 ± 0.057 |
Met |
Asn |
Gln |
Pro |
Arg |
Ser |
Thr |
Val |
Trp |
Tyr |
|---|---|---|---|---|---|---|---|---|---|
2.442 ± 0.025 | 2.594 ± 0.034 |
5.282 ± 0.033 | 3.359 ± 0.024 |
7.242 ± 0.043 | 5.394 ± 0.031 |
5.363 ± 0.033 | 7.267 ± 0.039 |
1.429 ± 0.019 | 2.2 ± 0.024 |
Most of the basic statistics you can see at this page can be downloaded from this CSV file
See this proteome in:

Proteome-pI is available under Creative Commons Attribution-NoDerivs license, for more details see here
| Reference: Kozlowski LP. Proteome-pI 2.0: Proteome Isoelectric Point Database Update. Nucleic Acids Res. 2021, doi: 10.1093/nar/gkab944 | Contact: Lukasz P. Kozlowski |