Elderberry carlavirus D
Taxonomy: Viruses; Riboviria; Orthornavirae; Kitrinoviricota; Alsuviricetes; Tymovirales; Betaflexiviridae; Quinvirinae; Carlavirus; Sambucus virus D
Average proteome isoelectric point is 6.97
Get precalculated fractions of proteins
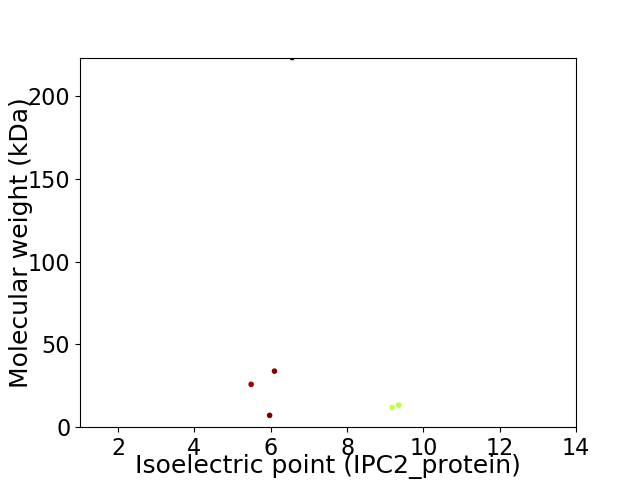
Virtual 2D-PAGE plot for 6 proteins (isoelectric point calculated using IPC2_protein)
Get csv file with sequences according to given criteria:
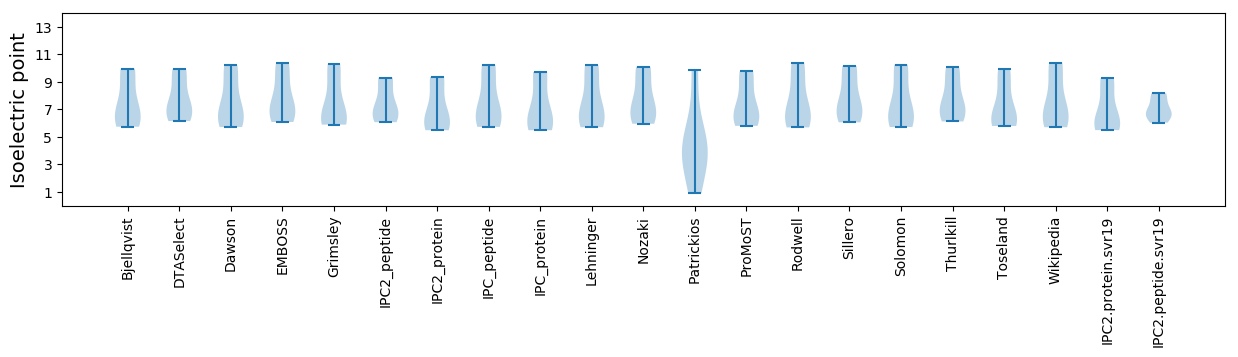
* You can choose from 21 different methods for calculating isoelectric point
Summary statistics related to proteome-wise predictions
Protein with the lowest isoelectric point:
>tr|A0A0A7M9C7|A0A0A7M9C7_9VIRU Replicase polyprotein OS=Elderberry carlavirus D OX=1569055 PE=3 SV=1
MM1 pKa = 8.07DD2 pKa = 5.25CLINLALGCGFEE14 pKa = 4.12RR15 pKa = 11.84VSVNHH20 pKa = 6.37NGVLVFNCVPGAGKK34 pKa = 8.48STLIRR39 pKa = 11.84KK40 pKa = 8.61ALHH43 pKa = 5.81KK44 pKa = 10.49DD45 pKa = 2.97SRR47 pKa = 11.84FVAFTFGKK55 pKa = 10.18ADD57 pKa = 3.46PVGQRR62 pKa = 11.84GRR64 pKa = 11.84SILPAALFDD73 pKa = 4.85SEE75 pKa = 4.53ATCGKK80 pKa = 9.99LVLVDD85 pKa = 5.01EE86 pKa = 4.57YY87 pKa = 11.57TEE89 pKa = 4.5GDD91 pKa = 3.26WRR93 pKa = 11.84ALGACAIFGDD103 pKa = 4.14PQQASVNRR111 pKa = 11.84LWPEE115 pKa = 3.73PNFVCLLSKK124 pKa = 10.82RR125 pKa = 11.84FGAQTAALLRR135 pKa = 11.84NLGHH139 pKa = 6.13EE140 pKa = 4.5VYY142 pKa = 10.35SEE144 pKa = 4.27KK145 pKa = 10.84EE146 pKa = 4.35DD147 pKa = 3.37IVEE150 pKa = 3.91WSGVFQGEE158 pKa = 3.93PRR160 pKa = 11.84GLVLAYY166 pKa = 9.18EE167 pKa = 4.35PEE169 pKa = 4.4VIEE172 pKa = 5.6LIKK175 pKa = 11.19DD176 pKa = 3.13HH177 pKa = 7.45DD178 pKa = 5.13LDD180 pKa = 4.3FLHH183 pKa = 7.03PNCCRR188 pKa = 11.84GITVEE193 pKa = 4.35HH194 pKa = 5.6VTFITSLDD202 pKa = 3.64HH203 pKa = 7.53FDD205 pKa = 3.6VNRR208 pKa = 11.84PDD210 pKa = 3.85LQYY213 pKa = 11.61LCLTRR218 pKa = 11.84HH219 pKa = 5.79SKK221 pKa = 10.61SLLILSPNATLGTAA235 pKa = 3.77
MM1 pKa = 8.07DD2 pKa = 5.25CLINLALGCGFEE14 pKa = 4.12RR15 pKa = 11.84VSVNHH20 pKa = 6.37NGVLVFNCVPGAGKK34 pKa = 8.48STLIRR39 pKa = 11.84KK40 pKa = 8.61ALHH43 pKa = 5.81KK44 pKa = 10.49DD45 pKa = 2.97SRR47 pKa = 11.84FVAFTFGKK55 pKa = 10.18ADD57 pKa = 3.46PVGQRR62 pKa = 11.84GRR64 pKa = 11.84SILPAALFDD73 pKa = 4.85SEE75 pKa = 4.53ATCGKK80 pKa = 9.99LVLVDD85 pKa = 5.01EE86 pKa = 4.57YY87 pKa = 11.57TEE89 pKa = 4.5GDD91 pKa = 3.26WRR93 pKa = 11.84ALGACAIFGDD103 pKa = 4.14PQQASVNRR111 pKa = 11.84LWPEE115 pKa = 3.73PNFVCLLSKK124 pKa = 10.82RR125 pKa = 11.84FGAQTAALLRR135 pKa = 11.84NLGHH139 pKa = 6.13EE140 pKa = 4.5VYY142 pKa = 10.35SEE144 pKa = 4.27KK145 pKa = 10.84EE146 pKa = 4.35DD147 pKa = 3.37IVEE150 pKa = 3.91WSGVFQGEE158 pKa = 3.93PRR160 pKa = 11.84GLVLAYY166 pKa = 9.18EE167 pKa = 4.35PEE169 pKa = 4.4VIEE172 pKa = 5.6LIKK175 pKa = 11.19DD176 pKa = 3.13HH177 pKa = 7.45DD178 pKa = 5.13LDD180 pKa = 4.3FLHH183 pKa = 7.03PNCCRR188 pKa = 11.84GITVEE193 pKa = 4.35HH194 pKa = 5.6VTFITSLDD202 pKa = 3.64HH203 pKa = 7.53FDD205 pKa = 3.6VNRR208 pKa = 11.84PDD210 pKa = 3.85LQYY213 pKa = 11.61LCLTRR218 pKa = 11.84HH219 pKa = 5.79SKK221 pKa = 10.61SLLILSPNATLGTAA235 pKa = 3.77
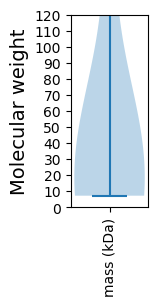
Molecular weight: 25.9 kDa
Isoelectric point according different methods:
Protein with the highest isoelectric point:
>tr|A0A0A7MB71|A0A0A7MB71_9VIRU Capsid protein OS=Elderberry carlavirus D OX=1569055 PE=3 SV=1
MM1 pKa = 7.68AGEE4 pKa = 4.44HH5 pKa = 5.01VQINPVVRR13 pKa = 11.84ALAEE17 pKa = 3.99AFEE20 pKa = 4.64VHH22 pKa = 7.05CSTNNNYY29 pKa = 10.53NYY31 pKa = 10.81YY32 pKa = 9.39SLCKK36 pKa = 10.24RR37 pKa = 11.84IVGLNKK43 pKa = 9.94EE44 pKa = 4.32VGTGRR49 pKa = 11.84SNMAKK54 pKa = 9.89RR55 pKa = 11.84RR56 pKa = 11.84RR57 pKa = 11.84AAALGRR63 pKa = 11.84SPRR66 pKa = 11.84CGRR69 pKa = 11.84VAPGFYY75 pKa = 9.52FTTKK79 pKa = 10.47CNGRR83 pKa = 11.84TCFDD87 pKa = 3.19AFGRR91 pKa = 11.84RR92 pKa = 11.84SEE94 pKa = 4.01LLRR97 pKa = 11.84YY98 pKa = 9.46IKK100 pKa = 10.41FGQRR104 pKa = 11.84KK105 pKa = 7.2EE106 pKa = 3.89TDD108 pKa = 3.39APNDD112 pKa = 3.64DD113 pKa = 4.53ANRR116 pKa = 11.84PMM118 pKa = 5.17
MM1 pKa = 7.68AGEE4 pKa = 4.44HH5 pKa = 5.01VQINPVVRR13 pKa = 11.84ALAEE17 pKa = 3.99AFEE20 pKa = 4.64VHH22 pKa = 7.05CSTNNNYY29 pKa = 10.53NYY31 pKa = 10.81YY32 pKa = 9.39SLCKK36 pKa = 10.24RR37 pKa = 11.84IVGLNKK43 pKa = 9.94EE44 pKa = 4.32VGTGRR49 pKa = 11.84SNMAKK54 pKa = 9.89RR55 pKa = 11.84RR56 pKa = 11.84RR57 pKa = 11.84AAALGRR63 pKa = 11.84SPRR66 pKa = 11.84CGRR69 pKa = 11.84VAPGFYY75 pKa = 9.52FTTKK79 pKa = 10.47CNGRR83 pKa = 11.84TCFDD87 pKa = 3.19AFGRR91 pKa = 11.84RR92 pKa = 11.84SEE94 pKa = 4.01LLRR97 pKa = 11.84YY98 pKa = 9.46IKK100 pKa = 10.41FGQRR104 pKa = 11.84KK105 pKa = 7.2EE106 pKa = 3.89TDD108 pKa = 3.39APNDD112 pKa = 3.64DD113 pKa = 4.53ANRR116 pKa = 11.84PMM118 pKa = 5.17
Molecular weight: 13.31 kDa
Isoelectric point according different methods:
Peptides (in silico digests for buttom-up proteomics)
Below you can find in silico digests of the whole proteome with Trypsin, Chymotrypsin, Trypsin+LysC, LysN, ArgC proteases suitable for different mass spec machines.| Try ESI |
 |
|---|
| ChTry ESI |
|
|---|
| ArgC ESI |
|
|---|
| LysN ESI |
|
|---|
| TryLysC ESI |
|
|---|
| Try MALDI |
|
|---|
| ChTry MALDI |
|
|---|
| ArgC MALDI |
|
|---|
| LysN MALDI |
|
|---|
| TryLysC MALDI |
|
|---|
| Try LTQ |
|
|---|
| ChTry LTQ |
|
|---|
| ArgC LTQ |
|
|---|
| LysN LTQ |
|
|---|
| TryLysC LTQ |
|
|---|
| Try MSlow |
|
|---|
| ChTry MSlow |
|
|---|
| ArgC MSlow |
|
|---|
| LysN MSlow |
|
|---|
| TryLysC MSlow |
|
|---|
| Try MShigh |
|
|---|
| ChTry MShigh |
|
|---|
| ArgC MShigh |
|
|---|
| LysN MShigh |
|
|---|
| TryLysC MShigh |
|
|---|
General Statistics
Number of major isoforms |
Number of additional isoforms |
Number of all proteins |
Number of amino acids |
Min. Seq. Length |
Max. Seq. Length |
Avg. Seq. Length |
Avg. Mol. Weight |
|---|---|---|---|---|---|---|---|
0 |
2811 |
66 |
1980 |
468.5 |
52.56 |
Amino acid frequency
Ala |
Cys |
Asp |
Glu |
Phe |
Gly |
His |
Ile |
Lys |
Leu |
|---|---|---|---|---|---|---|---|---|---|
7.577 ± 0.823 | 3.095 ± 0.436 |
4.589 ± 0.375 | 7.044 ± 0.933 |
5.301 ± 0.626 | 6.688 ± 0.534 |
2.206 ± 0.498 | 4.554 ± 0.325 |
5.514 ± 0.785 | 10.103 ± 1.039 |
Met |
Asn |
Gln |
Pro |
Arg |
Ser |
Thr |
Val |
Trp |
Tyr |
|---|---|---|---|---|---|---|---|---|---|
2.028 ± 0.378 | 4.447 ± 0.428 |
4.625 ± 0.799 | 2.775 ± 0.243 |
6.439 ± 0.656 | 7.364 ± 0.629 |
4.731 ± 0.698 | 6.581 ± 0.551 |
1.138 ± 0.151 | 3.202 ± 0.478 |
Most of the basic statistics you can see at this page can be downloaded from this CSV file
See this proteome in:

Proteome-pI is available under Creative Commons Attribution-NoDerivs license, for more details see here
| Reference: Kozlowski LP. Proteome-pI 2.0: Proteome Isoelectric Point Database Update. Nucleic Acids Res. 2021, doi: 10.1093/nar/gkab944 | Contact: Lukasz P. Kozlowski |