Beet pseudoyellows virus
Taxonomy: Viruses; Riboviria; Orthornavirae; Kitrinoviricota; Alsuviricetes; Martellivirales; Closteroviridae; Crinivirus
Average proteome isoelectric point is 6.78
Get precalculated fractions of proteins
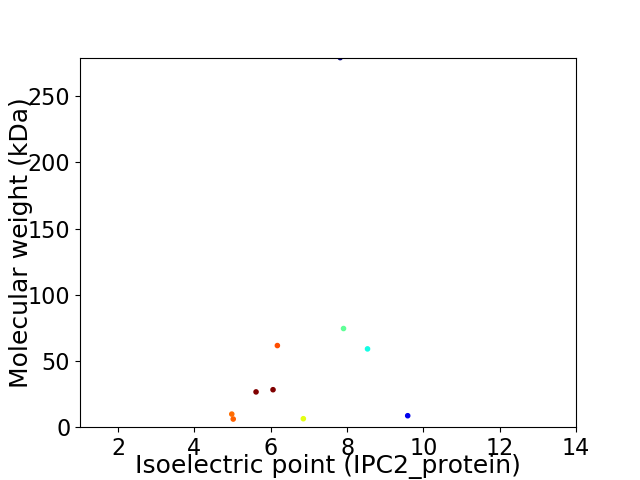
Virtual 2D-PAGE plot for 10 proteins (isoelectric point calculated using IPC2_protein)
Get csv file with sequences according to given criteria:
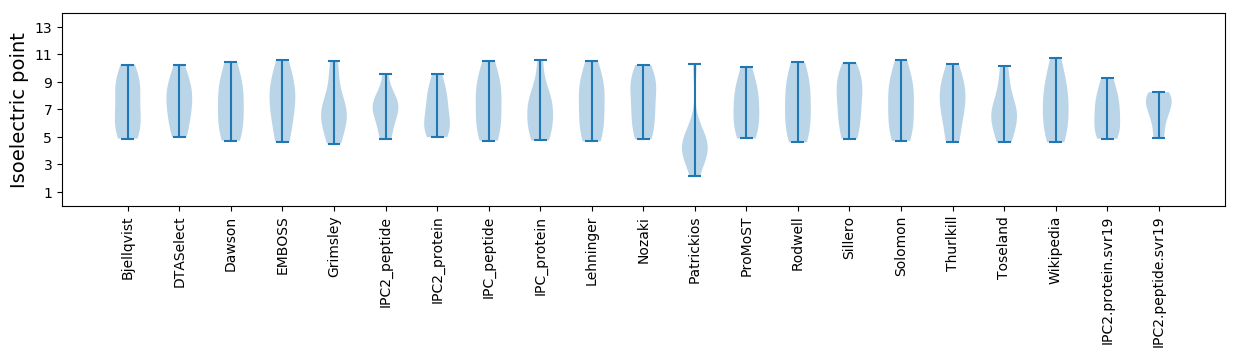
* You can choose from 21 different methods for calculating isoelectric point
Summary statistics related to proteome-wise predictions
Protein with the lowest isoelectric point:
>tr|Q6VRA5|Q6VRA5_9CLOS HSP70h OS=Beet pseudoyellows virus OX=72750 PE=3 SV=1
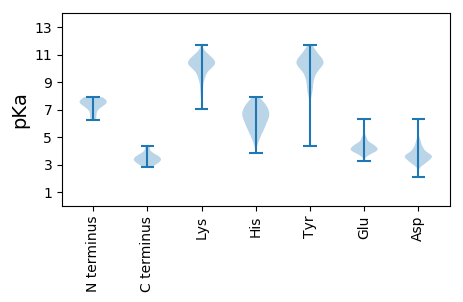
MM1 pKa = 7.44LCIFKK6 pKa = 10.41LRR8 pKa = 11.84QGGSFNVLYY17 pKa = 10.78LSDD20 pKa = 3.78SRR22 pKa = 11.84DD23 pKa = 3.5FSGEE27 pKa = 3.94TFLISSDD34 pKa = 3.83DD35 pKa = 3.66VTLLEE40 pKa = 5.01DD41 pKa = 4.76LMSHH45 pKa = 5.96LHH47 pKa = 7.0FIKK50 pKa = 9.52TQWW53 pKa = 2.86
MM1 pKa = 7.44LCIFKK6 pKa = 10.41LRR8 pKa = 11.84QGGSFNVLYY17 pKa = 10.78LSDD20 pKa = 3.78SRR22 pKa = 11.84DD23 pKa = 3.5FSGEE27 pKa = 3.94TFLISSDD34 pKa = 3.83DD35 pKa = 3.66VTLLEE40 pKa = 5.01DD41 pKa = 4.76LMSHH45 pKa = 5.96LHH47 pKa = 7.0FIKK50 pKa = 9.52TQWW53 pKa = 2.86
Molecular weight: 6.16 kDa
Isoelectric point according different methods:
Protein with the highest isoelectric point:
>tr|Q6VRA7|Q6VRA7_9CLOS ORF 2 OS=Beet pseudoyellows virus OX=72750 PE=4 SV=1
MM1 pKa = 7.45VINSGLVSGPTRR13 pKa = 11.84GGVIPTILGLFDD25 pKa = 3.77VPIRR29 pKa = 11.84PHH31 pKa = 6.46KK32 pKa = 10.5NIYY35 pKa = 9.28EE36 pKa = 3.79ISGFFNMLILCVLIFLFLNRR56 pKa = 11.84FLLRR60 pKa = 11.84FRR62 pKa = 11.84SNGYY66 pKa = 8.84VIRR69 pKa = 11.84DD70 pKa = 3.4NRR72 pKa = 11.84FDD74 pKa = 3.71SVV76 pKa = 3.12
MM1 pKa = 7.45VINSGLVSGPTRR13 pKa = 11.84GGVIPTILGLFDD25 pKa = 3.77VPIRR29 pKa = 11.84PHH31 pKa = 6.46KK32 pKa = 10.5NIYY35 pKa = 9.28EE36 pKa = 3.79ISGFFNMLILCVLIFLFLNRR56 pKa = 11.84FLLRR60 pKa = 11.84FRR62 pKa = 11.84SNGYY66 pKa = 8.84VIRR69 pKa = 11.84DD70 pKa = 3.4NRR72 pKa = 11.84FDD74 pKa = 3.71SVV76 pKa = 3.12
Molecular weight: 8.67 kDa
Isoelectric point according different methods:
Peptides (in silico digests for buttom-up proteomics)
Below you can find in silico digests of the whole proteome with Trypsin, Chymotrypsin, Trypsin+LysC, LysN, ArgC proteases suitable for different mass spec machines.| Try ESI |
 |
|---|
| ChTry ESI |
|
|---|
| ArgC ESI |
|
|---|
| LysN ESI |
|
|---|
| TryLysC ESI |
|
|---|
| Try MALDI |
|
|---|
| ChTry MALDI |
|
|---|
| ArgC MALDI |
|
|---|
| LysN MALDI |
|
|---|
| TryLysC MALDI |
|
|---|
| Try LTQ |
|
|---|
| ChTry LTQ |
|
|---|
| ArgC LTQ |
|
|---|
| LysN LTQ |
|
|---|
| TryLysC LTQ |
|
|---|
| Try MSlow |
|
|---|
| ChTry MSlow |
|
|---|
| ArgC MSlow |
|
|---|
| LysN MSlow |
|
|---|
| TryLysC MSlow |
|
|---|
| Try MShigh |
|
|---|
| ChTry MShigh |
|
|---|
| ArgC MShigh |
|
|---|
| LysN MShigh |
|
|---|
| TryLysC MShigh |
|
|---|
General Statistics
Number of major isoforms |
Number of additional isoforms |
Number of all proteins |
Number of amino acids |
Min. Seq. Length |
Max. Seq. Length |
Avg. Seq. Length |
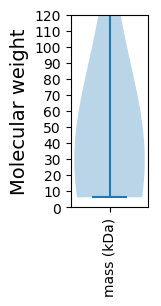
Avg. Mol. Weight |
|---|---|---|---|---|---|---|---|
0 |
4916 |
53 |
2441 |
491.6 |
56.07 |
Amino acid frequency
Ala |
Cys |
Asp |
Glu |
Phe |
Gly |
His |
Ile |
Lys |
Leu |
|---|---|---|---|---|---|---|---|---|---|
4.007 ± 0.366 | 1.851 ± 0.23 |
6.448 ± 0.411 | 5.289 ± 0.358 |
5.899 ± 0.391 | 4.76 ± 0.285 |
1.566 ± 0.195 | 7.099 ± 0.262 |
7.445 ± 0.282 | 9.825 ± 0.444 |
Met |
Asn |
Gln |
Pro |
Arg |
Ser |
Thr |
Val |
Trp |
Tyr |
|---|---|---|---|---|---|---|---|---|---|
2.421 ± 0.442 | 5.858 ± 0.66 |
3.214 ± 0.295 | 2.746 ± 0.352 |
5.207 ± 0.433 | 9.154 ± 0.481 |
5.696 ± 0.329 | 7.018 ± 0.399 |
0.529 ± 0.086 | 3.967 ± 0.209 |
Most of the basic statistics you can see at this page can be downloaded from this CSV file
See this proteome in:

Proteome-pI is available under Creative Commons Attribution-NoDerivs license, for more details see here
| Reference: Kozlowski LP. Proteome-pI 2.0: Proteome Isoelectric Point Database Update. Nucleic Acids Res. 2021, doi: 10.1093/nar/gkab944 | Contact: Lukasz P. Kozlowski |