Colletotrichum tofieldiae
Taxonomy: cellular organisms; Eukaryota; Opisthokonta; Fungi; Dikarya; Ascomycota; saccharomyceta; Pezizomycotina; leotiomyceta; sordariomyceta; Sordariomycetes; Hypocreomycetidae; Glomerellales; Glomerellaceae; Colletotrichum; Colletotrichum spaethianum species complex
Average proteome isoelectric point is 6.48
Get precalculated fractions of proteins
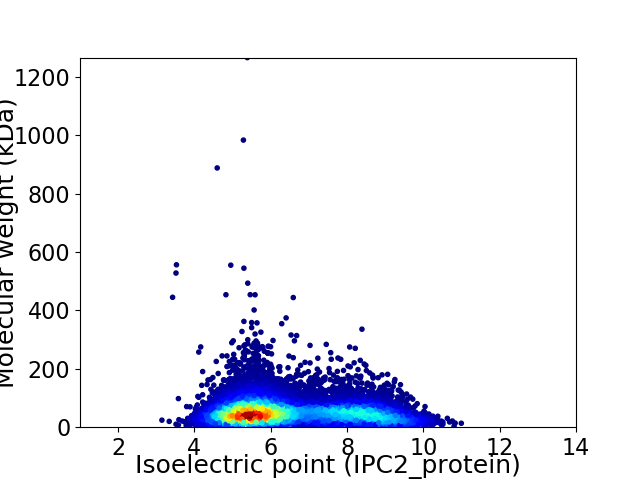
Virtual 2D-PAGE plot for 12499 proteins (isoelectric point calculated using IPC2_protein)
Get csv file with sequences according to given criteria:
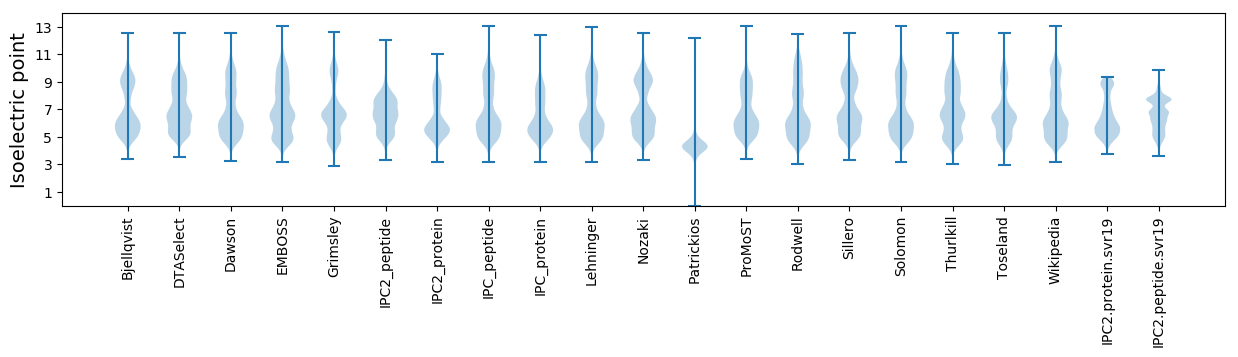
* You can choose from 21 different methods for calculating isoelectric point
Summary statistics related to proteome-wise predictions
Protein with the lowest isoelectric point:
>tr|A0A166TFK7|A0A166TFK7_9PEZI Uncharacterized protein OS=Colletotrichum tofieldiae OX=708197 GN=CT0861_03357 PE=4 SV=1
MM1 pKa = 7.56HH2 pKa = 7.5LTTIAALSLFTQLASAQTVVTITEE26 pKa = 4.62GPPSPTAEE34 pKa = 4.4PEE36 pKa = 3.94WTSDD40 pKa = 3.49DD41 pKa = 3.92TFTSAVLNSTNFYY54 pKa = 10.46RR55 pKa = 11.84NEE57 pKa = 3.95HH58 pKa = 5.92NASDD62 pKa = 4.07VTWNDD67 pKa = 2.99TLADD71 pKa = 3.95FAIDD75 pKa = 3.84YY76 pKa = 10.3LDD78 pKa = 4.88DD79 pKa = 3.85MSGDD83 pKa = 3.64SCDD86 pKa = 4.21FEE88 pKa = 5.93HH89 pKa = 7.41SGGPYY94 pKa = 10.49GEE96 pKa = 4.61NLAKK100 pKa = 10.54GYY102 pKa = 9.83PNTTLSIEE110 pKa = 3.93AWGDD114 pKa = 3.18EE115 pKa = 3.9RR116 pKa = 11.84DD117 pKa = 5.24DD118 pKa = 4.04YY119 pKa = 12.06DD120 pKa = 3.85FDD122 pKa = 4.63KK123 pKa = 11.85GEE125 pKa = 3.96FDD127 pKa = 4.03EE128 pKa = 4.76DD129 pKa = 3.7TGHH132 pKa = 6.34FTQLVWKK139 pKa = 8.35NTTDD143 pKa = 3.36VGCGRR148 pKa = 11.84KK149 pKa = 9.52LCGDD153 pKa = 3.78GQWYY157 pKa = 8.47LVCEE161 pKa = 3.83YY162 pKa = 9.57WPRR165 pKa = 11.84GNVVGQFVEE174 pKa = 4.73QVQEE178 pKa = 3.92EE179 pKa = 4.35ALGARR184 pKa = 11.84TAPGMLLGIVVMASFWTLSS203 pKa = 3.2
MM1 pKa = 7.56HH2 pKa = 7.5LTTIAALSLFTQLASAQTVVTITEE26 pKa = 4.62GPPSPTAEE34 pKa = 4.4PEE36 pKa = 3.94WTSDD40 pKa = 3.49DD41 pKa = 3.92TFTSAVLNSTNFYY54 pKa = 10.46RR55 pKa = 11.84NEE57 pKa = 3.95HH58 pKa = 5.92NASDD62 pKa = 4.07VTWNDD67 pKa = 2.99TLADD71 pKa = 3.95FAIDD75 pKa = 3.84YY76 pKa = 10.3LDD78 pKa = 4.88DD79 pKa = 3.85MSGDD83 pKa = 3.64SCDD86 pKa = 4.21FEE88 pKa = 5.93HH89 pKa = 7.41SGGPYY94 pKa = 10.49GEE96 pKa = 4.61NLAKK100 pKa = 10.54GYY102 pKa = 9.83PNTTLSIEE110 pKa = 3.93AWGDD114 pKa = 3.18EE115 pKa = 3.9RR116 pKa = 11.84DD117 pKa = 5.24DD118 pKa = 4.04YY119 pKa = 12.06DD120 pKa = 3.85FDD122 pKa = 4.63KK123 pKa = 11.85GEE125 pKa = 3.96FDD127 pKa = 4.03EE128 pKa = 4.76DD129 pKa = 3.7TGHH132 pKa = 6.34FTQLVWKK139 pKa = 8.35NTTDD143 pKa = 3.36VGCGRR148 pKa = 11.84KK149 pKa = 9.52LCGDD153 pKa = 3.78GQWYY157 pKa = 8.47LVCEE161 pKa = 3.83YY162 pKa = 9.57WPRR165 pKa = 11.84GNVVGQFVEE174 pKa = 4.73QVQEE178 pKa = 3.92EE179 pKa = 4.35ALGARR184 pKa = 11.84TAPGMLLGIVVMASFWTLSS203 pKa = 3.2
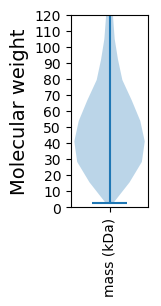
Molecular weight: 22.42 kDa
Isoelectric point according different methods:
Protein with the highest isoelectric point:
>tr|A0A161VNC6|A0A161VNC6_9PEZI Cwf15/Cwc15 cell cycle control protein (Fragment) OS=Colletotrichum tofieldiae OX=708197 GN=CT0861_06313 PE=3 SV=1
LL1 pKa = 8.17LEE3 pKa = 5.0ARR5 pKa = 11.84TTTPPLRR12 pKa = 11.84LTSPSKK18 pKa = 10.64RR19 pKa = 11.84SLAVSWTSSTAWPVVVARR37 pKa = 11.84ARR39 pKa = 11.84SGRR42 pKa = 11.84TVLIRR47 pKa = 11.84PSTSSKK53 pKa = 10.54KK54 pKa = 10.14SFSAKK59 pKa = 9.0VLRR62 pKa = 11.84TTKK65 pKa = 10.55APPSKK70 pKa = 10.17RR71 pKa = 11.84KK72 pKa = 8.84MNRR75 pKa = 11.84FPILSGASTRR85 pKa = 11.84TPPARR90 pKa = 11.84RR91 pKa = 11.84FPSRR95 pKa = 11.84IRR97 pKa = 11.84TRR99 pKa = 11.84SLVSKK104 pKa = 10.51CLLAPSTTHH113 pKa = 7.19RR114 pKa = 11.84AASPPTIRR122 pKa = 11.84LHH124 pKa = 7.21DD125 pKa = 3.95RR126 pKa = 11.84STT128 pKa = 3.14
LL1 pKa = 8.17LEE3 pKa = 5.0ARR5 pKa = 11.84TTTPPLRR12 pKa = 11.84LTSPSKK18 pKa = 10.64RR19 pKa = 11.84SLAVSWTSSTAWPVVVARR37 pKa = 11.84ARR39 pKa = 11.84SGRR42 pKa = 11.84TVLIRR47 pKa = 11.84PSTSSKK53 pKa = 10.54KK54 pKa = 10.14SFSAKK59 pKa = 9.0VLRR62 pKa = 11.84TTKK65 pKa = 10.55APPSKK70 pKa = 10.17RR71 pKa = 11.84KK72 pKa = 8.84MNRR75 pKa = 11.84FPILSGASTRR85 pKa = 11.84TPPARR90 pKa = 11.84RR91 pKa = 11.84FPSRR95 pKa = 11.84IRR97 pKa = 11.84TRR99 pKa = 11.84SLVSKK104 pKa = 10.51CLLAPSTTHH113 pKa = 7.19RR114 pKa = 11.84AASPPTIRR122 pKa = 11.84LHH124 pKa = 7.21DD125 pKa = 3.95RR126 pKa = 11.84STT128 pKa = 3.14
Molecular weight: 14.07 kDa
Isoelectric point according different methods:
Peptides (in silico digests for buttom-up proteomics)
Below you can find in silico digests of the whole proteome with Trypsin, Chymotrypsin, Trypsin+LysC, LysN, ArgC proteases suitable for different mass spec machines.| Try ESI |
 |
|---|
| ChTry ESI |
|
|---|
| ArgC ESI |
|
|---|
| LysN ESI |
|
|---|
| TryLysC ESI |
|
|---|
| Try MALDI |
|
|---|
| ChTry MALDI |
|
|---|
| ArgC MALDI |
|
|---|
| LysN MALDI |
|
|---|
| TryLysC MALDI |
|
|---|
| Try LTQ |
|
|---|
| ChTry LTQ |
|
|---|
| ArgC LTQ |
|
|---|
| LysN LTQ |
|
|---|
| TryLysC LTQ |
|
|---|
| Try MSlow |
|
|---|
| ChTry MSlow |
|
|---|
| ArgC MSlow |
|
|---|
| LysN MSlow |
|
|---|
| TryLysC MSlow |
|
|---|
| Try MShigh |
|
|---|
| ChTry MShigh |
|
|---|
| ArgC MShigh |
|
|---|
| LysN MShigh |
|
|---|
| TryLysC MShigh |
|
|---|
General Statistics
Number of major isoforms |
Number of additional isoforms |
Number of all proteins |
Number of amino acids |
Min. Seq. Length |
Max. Seq. Length |
Avg. Seq. Length |
Avg. Mol. Weight |
|---|---|---|---|---|---|---|---|
0 |
6353999 |
25 |
11475 |
508.4 |
56.05 |
Amino acid frequency
Ala |
Cys |
Asp |
Glu |
Phe |
Gly |
His |
Ile |
Lys |
Leu |
|---|---|---|---|---|---|---|---|---|---|
9.119 ± 0.021 | 1.235 ± 0.009 |
5.673 ± 0.014 | 5.988 ± 0.024 |
3.76 ± 0.013 | 7.124 ± 0.02 |
2.344 ± 0.01 | 4.725 ± 0.015 |
4.764 ± 0.022 | 8.778 ± 0.021 |
Met |
Asn |
Gln |
Pro |
Arg |
Ser |
Thr |
Val |
Trp |
Tyr |
|---|---|---|---|---|---|---|---|---|---|
2.169 ± 0.009 | 3.654 ± 0.012 |
6.129 ± 0.022 | 3.91 ± 0.017 |
6.016 ± 0.02 | 7.99 ± 0.025 |
6.041 ± 0.029 | 6.332 ± 0.017 |
1.536 ± 0.007 | 2.712 ± 0.009 |
Most of the basic statistics you can see at this page can be downloaded from this CSV file
See this proteome in:

Proteome-pI is available under Creative Commons Attribution-NoDerivs license, for more details see here
| Reference: Kozlowski LP. Proteome-pI 2.0: Proteome Isoelectric Point Database Update. Nucleic Acids Res. 2021, doi: 10.1093/nar/gkab944 | Contact: Lukasz P. Kozlowski |