Bacillus phage SPP1 (Bacteriophage SPP1)
Taxonomy: Viruses; Duplodnaviria; Heunggongvirae; Uroviricota; Caudoviricetes; Caudovirales; Siphoviridae; unclassified Siphoviridae
Average proteome isoelectric point is 7.03
Get precalculated fractions of proteins
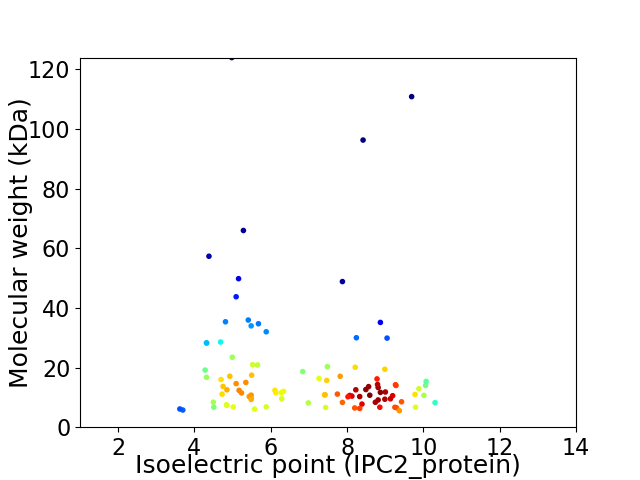
Virtual 2D-PAGE plot for 100 proteins (isoelectric point calculated using IPC2_protein)
Get csv file with sequences according to given criteria:
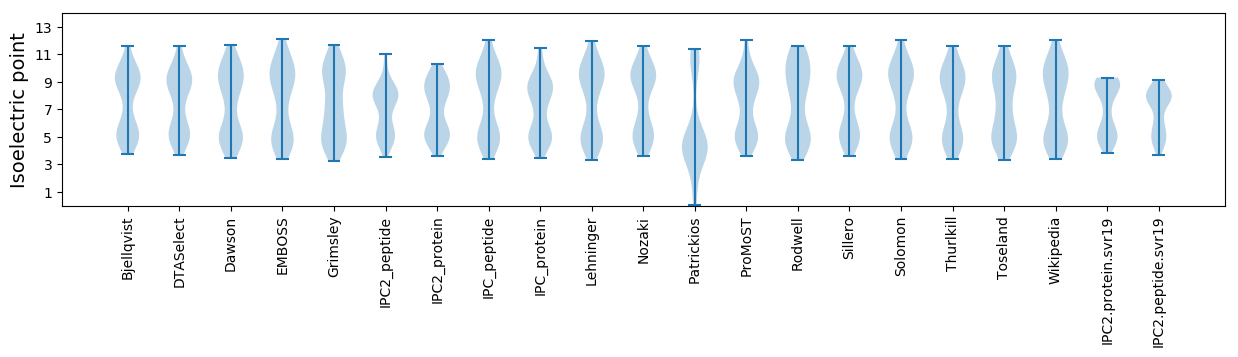
* You can choose from 21 different methods for calculating isoelectric point
Summary statistics related to proteome-wise predictions
Protein with the lowest isoelectric point:
>tr|O48469|O48469_BPSPP Uncharacterized protein OS=Bacillus phage SPP1 OX=10724 PE=4 SV=1
MM1 pKa = 7.55SEE3 pKa = 4.13SLLYY7 pKa = 10.65GYY9 pKa = 10.64FLDD12 pKa = 3.75SWLDD16 pKa = 3.53GTASEE21 pKa = 4.22EE22 pKa = 4.09LLRR25 pKa = 11.84VAVNAGDD32 pKa = 3.91LTQEE36 pKa = 4.15EE37 pKa = 4.54ADD39 pKa = 4.75KK40 pKa = 11.23IMSYY44 pKa = 10.36PWGAWNDD51 pKa = 3.42
MM1 pKa = 7.55SEE3 pKa = 4.13SLLYY7 pKa = 10.65GYY9 pKa = 10.64FLDD12 pKa = 3.75SWLDD16 pKa = 3.53GTASEE21 pKa = 4.22EE22 pKa = 4.09LLRR25 pKa = 11.84VAVNAGDD32 pKa = 3.91LTQEE36 pKa = 4.15EE37 pKa = 4.54ADD39 pKa = 4.75KK40 pKa = 11.23IMSYY44 pKa = 10.36PWGAWNDD51 pKa = 3.42
Molecular weight: 5.76 kDa
Isoelectric point according different methods:
Protein with the highest isoelectric point:
>tr|O48465|O48465_BPSPP Uncharacterized protein OS=Bacillus phage SPP1 OX=10724 PE=1 SV=1
MM1 pKa = 7.84LDD3 pKa = 3.33GLGGFLSGKK12 pKa = 9.5APSVTSVIPPPVFHH26 pKa = 6.93LPSFFLKK33 pKa = 10.15RR34 pKa = 11.84SLMAPICLSISSKK47 pKa = 10.54LRR49 pKa = 11.84YY50 pKa = 9.44SPNSIVAPSSGLSVKK65 pKa = 10.19YY66 pKa = 10.43VILMTSASNSIGVANSRR83 pKa = 11.84SRR85 pKa = 11.84IIQVSPSFTFLGATSTLL102 pKa = 3.7
MM1 pKa = 7.84LDD3 pKa = 3.33GLGGFLSGKK12 pKa = 9.5APSVTSVIPPPVFHH26 pKa = 6.93LPSFFLKK33 pKa = 10.15RR34 pKa = 11.84SLMAPICLSISSKK47 pKa = 10.54LRR49 pKa = 11.84YY50 pKa = 9.44SPNSIVAPSSGLSVKK65 pKa = 10.19YY66 pKa = 10.43VILMTSASNSIGVANSRR83 pKa = 11.84SRR85 pKa = 11.84IIQVSPSFTFLGATSTLL102 pKa = 3.7
Molecular weight: 10.67 kDa
Isoelectric point according different methods:
Peptides (in silico digests for buttom-up proteomics)
Below you can find in silico digests of the whole proteome with Trypsin, Chymotrypsin, Trypsin+LysC, LysN, ArgC proteases suitable for different mass spec machines.| Try ESI |
 |
|---|
| ChTry ESI |
|
|---|
| ArgC ESI |
|
|---|
| LysN ESI |
|
|---|
| TryLysC ESI |
|
|---|
| Try MALDI |
|
|---|
| ChTry MALDI |
|
|---|
| ArgC MALDI |
|
|---|
| LysN MALDI |
|
|---|
| TryLysC MALDI |
|
|---|
| Try LTQ |
|
|---|
| ChTry LTQ |
|
|---|
| ArgC LTQ |
|
|---|
| LysN LTQ |
|
|---|
| TryLysC LTQ |
|
|---|
| Try MSlow |
|
|---|
| ChTry MSlow |
|
|---|
| ArgC MSlow |
|
|---|
| LysN MSlow |
|
|---|
| TryLysC MSlow |
|
|---|
| Try MShigh |
|
|---|
| ChTry MShigh |
|
|---|
| ArgC MShigh |
|
|---|
| LysN MShigh |
|
|---|
| TryLysC MShigh |
|
|---|
General Statistics
Number of major isoforms |
Number of additional isoforms |
Number of all proteins |
Number of amino acids |
Min. Seq. Length |
Max. Seq. Length |
Avg. Seq. Length |
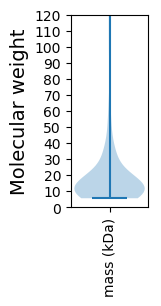
Avg. Mol. Weight |
|---|---|---|---|---|---|---|---|
16868 |
51 |
1111 |
168.7 |
19.01 |
Amino acid frequency
Ala |
Cys |
Asp |
Glu |
Phe |
Gly |
His |
Ile |
Lys |
Leu |
|---|---|---|---|---|---|---|---|---|---|
6.978 ± 0.532 | 1.174 ± 0.202 |
5.371 ± 0.341 | 6.942 ± 0.501 |
4.903 ± 0.321 | 6.723 ± 0.308 |
1.672 ± 0.145 | 6.634 ± 0.236 |
7.571 ± 0.387 | 7.825 ± 0.29 |
Met |
Asn |
Gln |
Pro |
Arg |
Ser |
Thr |
Val |
Trp |
Tyr |
|---|---|---|---|---|---|---|---|---|---|
2.929 ± 0.152 | 5.104 ± 0.324 |
4.079 ± 0.244 | 3.308 ± 0.206 |
4.95 ± 0.22 | 6.865 ± 0.435 |
5.721 ± 0.28 | 6.498 ± 0.236 |
1.209 ± 0.133 | 3.545 ± 0.267 |
Most of the basic statistics you can see at this page can be downloaded from this CSV file
See this proteome in:

Proteome-pI is available under Creative Commons Attribution-NoDerivs license, for more details see here
| Reference: Kozlowski LP. Proteome-pI 2.0: Proteome Isoelectric Point Database Update. Nucleic Acids Res. 2021, doi: 10.1093/nar/gkab944 | Contact: Lukasz P. Kozlowski |