Staphylococcus phage 3 AJ-2017
Taxonomy: Viruses; Duplodnaviria; Heunggongvirae; Uroviricota; Caudoviricetes; Caudovirales; Siphoviridae; Bronfenbrennervirinae; Peeveelvirus; Staphylococcus virus 3AJ2017
Average proteome isoelectric point is 6.79
Get precalculated fractions of proteins
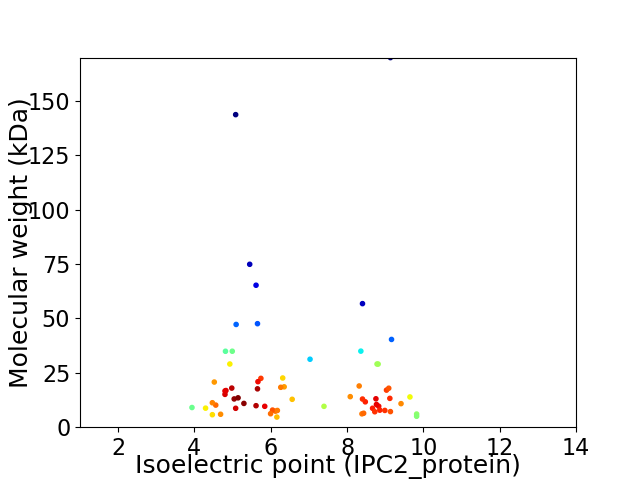
Virtual 2D-PAGE plot for 66 proteins (isoelectric point calculated using IPC2_protein)
Get csv file with sequences according to given criteria:
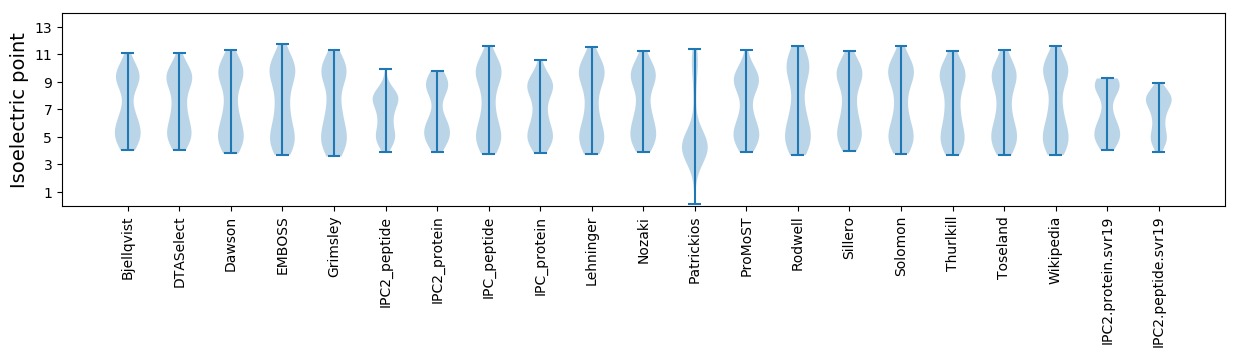
* You can choose from 21 different methods for calculating isoelectric point
Summary statistics related to proteome-wise predictions
Protein with the lowest isoelectric point:
>tr|A0A1P8L6G5|A0A1P8L6G5_9CAUD Uncharacterized protein OS=Staphylococcus phage 3 AJ-2017 OX=1934428 PE=4 SV=1
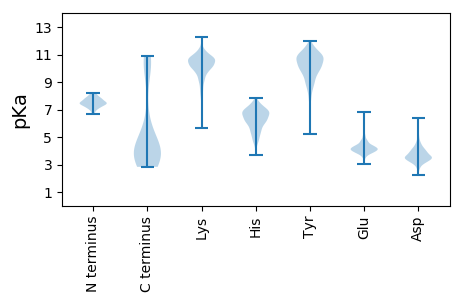
MM1 pKa = 7.42KK2 pKa = 10.25NYY4 pKa = 10.4YY5 pKa = 9.86HH6 pKa = 7.24LLSFDD11 pKa = 5.04DD12 pKa = 5.61DD13 pKa = 4.5LANDD17 pKa = 4.17AANDD21 pKa = 4.01LLKK24 pKa = 10.8EE25 pKa = 4.08GWDD28 pKa = 3.34IVHH31 pKa = 6.66VGTKK35 pKa = 9.51LVKK38 pKa = 10.36ILDD41 pKa = 3.92NGQAYY46 pKa = 10.82YY47 pKa = 8.91NTEE50 pKa = 3.97YY51 pKa = 11.47VLGGTKK57 pKa = 9.45NQYY60 pKa = 9.36EE61 pKa = 4.83KK62 pKa = 11.2YY63 pKa = 10.75LEE65 pKa = 4.8DD66 pKa = 4.04CQQSEE71 pKa = 4.31LDD73 pKa = 3.76YY74 pKa = 11.3FF75 pKa = 4.23
MM1 pKa = 7.42KK2 pKa = 10.25NYY4 pKa = 10.4YY5 pKa = 9.86HH6 pKa = 7.24LLSFDD11 pKa = 5.04DD12 pKa = 5.61DD13 pKa = 4.5LANDD17 pKa = 4.17AANDD21 pKa = 4.01LLKK24 pKa = 10.8EE25 pKa = 4.08GWDD28 pKa = 3.34IVHH31 pKa = 6.66VGTKK35 pKa = 9.51LVKK38 pKa = 10.36ILDD41 pKa = 3.92NGQAYY46 pKa = 10.82YY47 pKa = 8.91NTEE50 pKa = 3.97YY51 pKa = 11.47VLGGTKK57 pKa = 9.45NQYY60 pKa = 9.36EE61 pKa = 4.83KK62 pKa = 11.2YY63 pKa = 10.75LEE65 pKa = 4.8DD66 pKa = 4.04CQQSEE71 pKa = 4.31LDD73 pKa = 3.76YY74 pKa = 11.3FF75 pKa = 4.23
Molecular weight: 8.76 kDa
Isoelectric point according different methods:
Protein with the highest isoelectric point:
>tr|A0A1P8L6B2|A0A1P8L6B2_9CAUD Lysin OS=Staphylococcus phage 3 AJ-2017 OX=1934428 PE=4 SV=1
MM1 pKa = 7.2VALLKK6 pKa = 10.65SLEE9 pKa = 3.97RR10 pKa = 11.84RR11 pKa = 11.84RR12 pKa = 11.84LMITISTMLQFGLFLIALIGLVIKK36 pKa = 10.76LIEE39 pKa = 4.3LSNKK43 pKa = 9.19KK44 pKa = 10.07
MM1 pKa = 7.2VALLKK6 pKa = 10.65SLEE9 pKa = 3.97RR10 pKa = 11.84RR11 pKa = 11.84RR12 pKa = 11.84LMITISTMLQFGLFLIALIGLVIKK36 pKa = 10.76LIEE39 pKa = 4.3LSNKK43 pKa = 9.19KK44 pKa = 10.07
Molecular weight: 5.03 kDa
Isoelectric point according different methods:
Peptides (in silico digests for buttom-up proteomics)
Below you can find in silico digests of the whole proteome with Trypsin, Chymotrypsin, Trypsin+LysC, LysN, ArgC proteases suitable for different mass spec machines.| Try ESI |
 |
|---|
| ChTry ESI |
|
|---|
| ArgC ESI |
|
|---|
| LysN ESI |
|
|---|
| TryLysC ESI |
|
|---|
| Try MALDI |
|
|---|
| ChTry MALDI |
|
|---|
| ArgC MALDI |
|
|---|
| LysN MALDI |
|
|---|
| TryLysC MALDI |
|
|---|
| Try LTQ |
|
|---|
| ChTry LTQ |
|
|---|
| ArgC LTQ |
|
|---|
| LysN LTQ |
|
|---|
| TryLysC LTQ |
|
|---|
| Try MSlow |
|
|---|
| ChTry MSlow |
|
|---|
| ArgC MSlow |
|
|---|
| LysN MSlow |
|
|---|
| TryLysC MSlow |
|
|---|
| Try MShigh |
|
|---|
| ChTry MShigh |
|
|---|
| ArgC MShigh |
|
|---|
| LysN MShigh |
|
|---|
| TryLysC MShigh |
|
|---|
General Statistics
Number of major isoforms |
Number of additional isoforms |
Number of all proteins |
Number of amino acids |
Min. Seq. Length |
Max. Seq. Length |
Avg. Seq. Length |
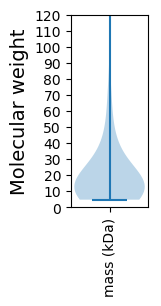
Avg. Mol. Weight |
|---|---|---|---|---|---|---|---|
0 |
12866 |
40 |
1550 |
194.9 |
22.36 |
Amino acid frequency
Ala |
Cys |
Asp |
Glu |
Phe |
Gly |
His |
Ile |
Lys |
Leu |
|---|---|---|---|---|---|---|---|---|---|
5.441 ± 0.467 | 0.544 ± 0.096 |
6.062 ± 0.378 | 7.687 ± 0.534 |
3.956 ± 0.22 | 5.55 ± 0.586 |
1.795 ± 0.16 | 7.788 ± 0.284 |
9.529 ± 0.339 | 8.239 ± 0.32 |
Met |
Asn |
Gln |
Pro |
Arg |
Ser |
Thr |
Val |
Trp |
Tyr |
|---|---|---|---|---|---|---|---|---|---|
2.542 ± 0.228 | 6.801 ± 0.298 |
2.604 ± 0.182 | 3.964 ± 0.235 |
4.259 ± 0.263 | 6.016 ± 0.241 |
6.125 ± 0.201 | 5.705 ± 0.246 |
1.073 ± 0.168 | 4.321 ± 0.305 |
Most of the basic statistics you can see at this page can be downloaded from this CSV file
See this proteome in:

Proteome-pI is available under Creative Commons Attribution-NoDerivs license, for more details see here
| Reference: Kozlowski LP. Proteome-pI 2.0: Proteome Isoelectric Point Database Update. Nucleic Acids Res. 2021, doi: 10.1093/nar/gkab944 | Contact: Lukasz P. Kozlowski |