Anaerocolumna cellulosilytica
Taxonomy: cellular organisms; Bacteria; Terrabacteria group; Firmicutes; Clostridia; Eubacteriales; Lachnospiraceae; Anaerocolumna
Average proteome isoelectric point is 6.23
Get precalculated fractions of proteins
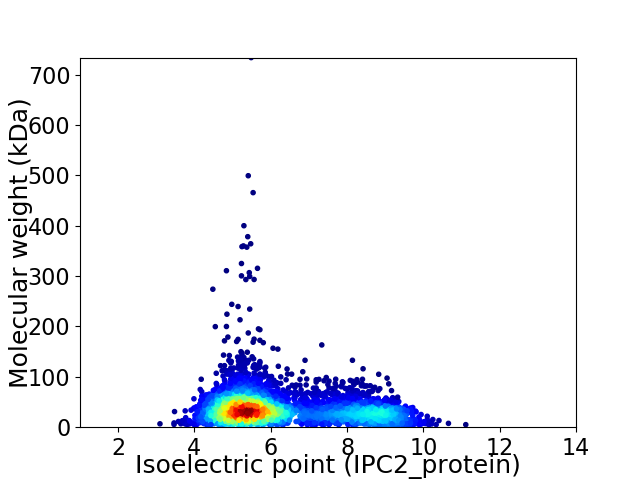
Virtual 2D-PAGE plot for 4494 proteins (isoelectric point calculated using IPC2_protein)
Get csv file with sequences according to given criteria:
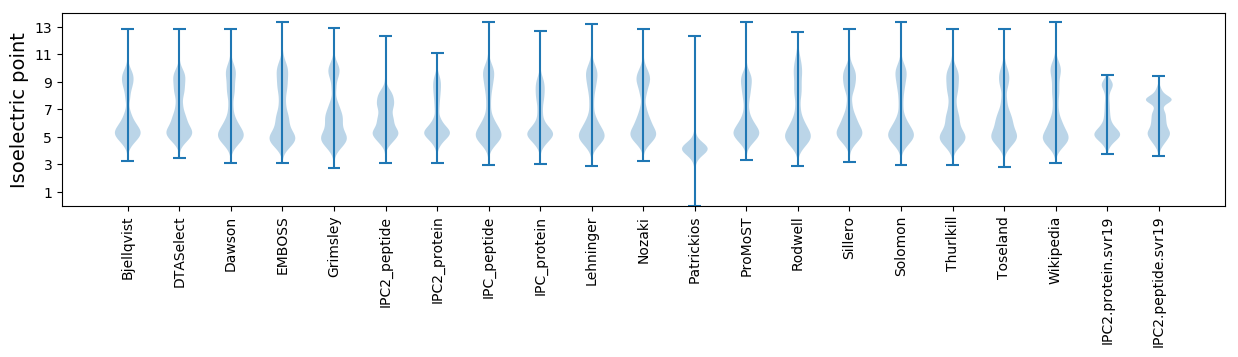
* You can choose from 21 different methods for calculating isoelectric point
Summary statistics related to proteome-wise predictions
Protein with the lowest isoelectric point:
>tr|A0A6S6R1X9|A0A6S6R1X9_9FIRM Thioredoxin OS=Anaerocolumna cellulosilytica OX=433286 GN=trx2 PE=3 SV=1
MM1 pKa = 7.72LIAINEE7 pKa = 4.13DD8 pKa = 3.27EE9 pKa = 4.54RR10 pKa = 11.84SIIHH14 pKa = 7.38DD15 pKa = 3.54MFDD18 pKa = 3.28NFIVLLLEE26 pKa = 4.66KK27 pKa = 10.82DD28 pKa = 3.38NALNMTGCNTYY39 pKa = 10.8KK40 pKa = 10.67EE41 pKa = 4.67FVDD44 pKa = 5.5DD45 pKa = 3.85MVEE48 pKa = 4.18YY49 pKa = 10.39ICC51 pKa = 6.17
MM1 pKa = 7.72LIAINEE7 pKa = 4.13DD8 pKa = 3.27EE9 pKa = 4.54RR10 pKa = 11.84SIIHH14 pKa = 7.38DD15 pKa = 3.54MFDD18 pKa = 3.28NFIVLLLEE26 pKa = 4.66KK27 pKa = 10.82DD28 pKa = 3.38NALNMTGCNTYY39 pKa = 10.8KK40 pKa = 10.67EE41 pKa = 4.67FVDD44 pKa = 5.5DD45 pKa = 3.85MVEE48 pKa = 4.18YY49 pKa = 10.39ICC51 pKa = 6.17
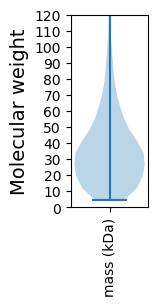
Molecular weight: 6.0 kDa
Isoelectric point according different methods:
Protein with the highest isoelectric point:
>tr|A0A6S6R6P8|A0A6S6R6P8_9FIRM FAD-dependent oxidoreductase OS=Anaerocolumna cellulosilytica OX=433286 GN=acsn021_27290 PE=4 SV=1
MM1 pKa = 7.67KK2 pKa = 8.72MTFQPKK8 pKa = 9.06KK9 pKa = 8.03RR10 pKa = 11.84SRR12 pKa = 11.84SKK14 pKa = 9.44VHH16 pKa = 6.17GFRR19 pKa = 11.84ARR21 pKa = 11.84MSTSNGRR28 pKa = 11.84KK29 pKa = 8.69VLASRR34 pKa = 11.84RR35 pKa = 11.84AKK37 pKa = 10.26GRR39 pKa = 11.84HH40 pKa = 5.5KK41 pKa = 10.9LSAA44 pKa = 3.8
MM1 pKa = 7.67KK2 pKa = 8.72MTFQPKK8 pKa = 9.06KK9 pKa = 8.03RR10 pKa = 11.84SRR12 pKa = 11.84SKK14 pKa = 9.44VHH16 pKa = 6.17GFRR19 pKa = 11.84ARR21 pKa = 11.84MSTSNGRR28 pKa = 11.84KK29 pKa = 8.69VLASRR34 pKa = 11.84RR35 pKa = 11.84AKK37 pKa = 10.26GRR39 pKa = 11.84HH40 pKa = 5.5KK41 pKa = 10.9LSAA44 pKa = 3.8
Molecular weight: 5.07 kDa
Isoelectric point according different methods:
Peptides (in silico digests for buttom-up proteomics)
Below you can find in silico digests of the whole proteome with Trypsin, Chymotrypsin, Trypsin+LysC, LysN, ArgC proteases suitable for different mass spec machines.| Try ESI |
 |
|---|
| ChTry ESI |
|
|---|
| ArgC ESI |
|
|---|
| LysN ESI |
|
|---|
| TryLysC ESI |
|
|---|
| Try MALDI |
|
|---|
| ChTry MALDI |
|
|---|
| ArgC MALDI |
|
|---|
| LysN MALDI |
|
|---|
| TryLysC MALDI |
|
|---|
| Try LTQ |
|
|---|
| ChTry LTQ |
|
|---|
| ArgC LTQ |
|
|---|
| LysN LTQ |
|
|---|
| TryLysC LTQ |
|
|---|
| Try MSlow |
|
|---|
| ChTry MSlow |
|
|---|
| ArgC MSlow |
|
|---|
| LysN MSlow |
|
|---|
| TryLysC MSlow |
|
|---|
| Try MShigh |
|
|---|
| ChTry MShigh |
|
|---|
| ArgC MShigh |
|
|---|
| LysN MShigh |
|
|---|
| TryLysC MShigh |
|
|---|
General Statistics
Number of major isoforms |
Number of additional isoforms |
Number of all proteins |
Number of amino acids |
Min. Seq. Length |
Max. Seq. Length |
Avg. Seq. Length |
Avg. Mol. Weight |
|---|---|---|---|---|---|---|---|
0 |
1532155 |
39 |
6555 |
340.9 |
38.47 |
Amino acid frequency
Ala |
Cys |
Asp |
Glu |
Phe |
Gly |
His |
Ile |
Lys |
Leu |
|---|---|---|---|---|---|---|---|---|---|
6.407 ± 0.036 | 1.237 ± 0.012 |
5.302 ± 0.026 | 7.429 ± 0.041 |
4.284 ± 0.028 | 6.608 ± 0.034 |
1.681 ± 0.015 | 8.371 ± 0.033 |
7.56 ± 0.031 | 9.406 ± 0.038 |
Met |
Asn |
Gln |
Pro |
Arg |
Ser |
Thr |
Val |
Trp |
Tyr |
|---|---|---|---|---|---|---|---|---|---|
2.7 ± 0.018 | 5.254 ± 0.03 |
3.069 ± 0.021 | 3.134 ± 0.018 |
3.758 ± 0.026 | 6.215 ± 0.03 |
5.685 ± 0.037 | 6.427 ± 0.03 |
0.88 ± 0.014 | 4.591 ± 0.028 |
Most of the basic statistics you can see at this page can be downloaded from this CSV file
See this proteome in:

Proteome-pI is available under Creative Commons Attribution-NoDerivs license, for more details see here
| Reference: Kozlowski LP. Proteome-pI 2.0: Proteome Isoelectric Point Database Update. Nucleic Acids Res. 2021, doi: 10.1093/nar/gkab944 | Contact: Lukasz P. Kozlowski |