Poplar mosaic virus
Taxonomy: Viruses; Riboviria; Orthornavirae; Kitrinoviricota; Alsuviricetes; Tymovirales; Betaflexiviridae; Quinvirinae; Carlavirus
Average proteome isoelectric point is 7.02
Get precalculated fractions of proteins
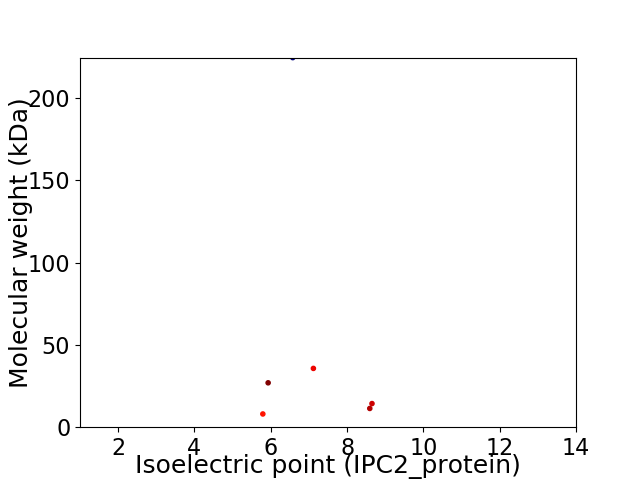
Virtual 2D-PAGE plot for 6 proteins (isoelectric point calculated using IPC2_protein)
Get csv file with sequences according to given criteria:
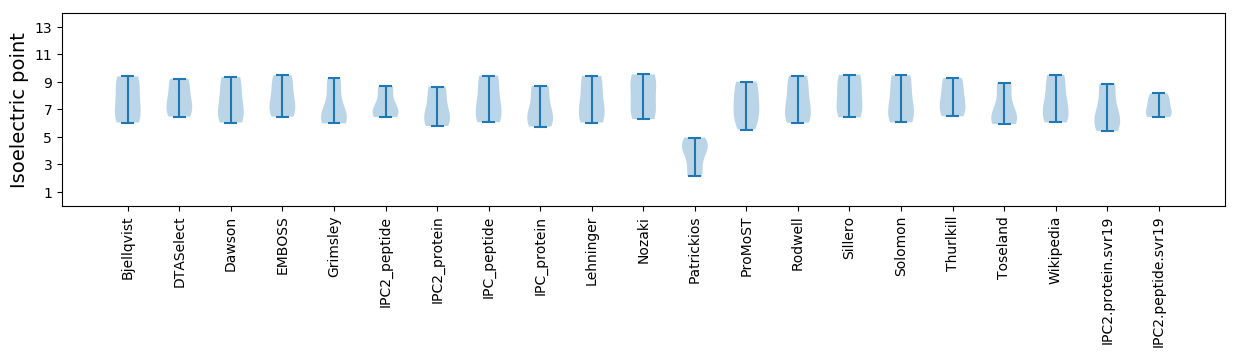
* You can choose from 21 different methods for calculating isoelectric point
Summary statistics related to proteome-wise predictions
Protein with the lowest isoelectric point:
>tr|Q6RBY7|Q6RBY7_9VIRU Movement protein TGB2 OS=Poplar mosaic virus OX=12166 GN=ORF3 PE=3 SV=1
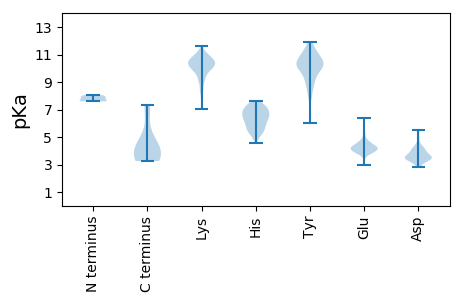
MM1 pKa = 7.6WSDD4 pKa = 3.49SLVSRR9 pKa = 11.84VCVPIIVVCTSIALLNVVSFRR30 pKa = 11.84SEE32 pKa = 4.16CSCVVHH38 pKa = 5.67ITGEE42 pKa = 4.23SIDD45 pKa = 3.46IRR47 pKa = 11.84GCSFTPDD54 pKa = 4.11FIEE57 pKa = 4.11YY58 pKa = 10.54AKK60 pKa = 9.58TLRR63 pKa = 11.84VFNHH67 pKa = 7.3RR68 pKa = 11.84YY69 pKa = 9.19QEE71 pKa = 3.91
MM1 pKa = 7.6WSDD4 pKa = 3.49SLVSRR9 pKa = 11.84VCVPIIVVCTSIALLNVVSFRR30 pKa = 11.84SEE32 pKa = 4.16CSCVVHH38 pKa = 5.67ITGEE42 pKa = 4.23SIDD45 pKa = 3.46IRR47 pKa = 11.84GCSFTPDD54 pKa = 4.11FIEE57 pKa = 4.11YY58 pKa = 10.54AKK60 pKa = 9.58TLRR63 pKa = 11.84VFNHH67 pKa = 7.3RR68 pKa = 11.84YY69 pKa = 9.19QEE71 pKa = 3.91
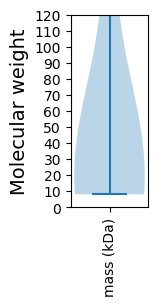
Molecular weight: 8.04 kDa
Isoelectric point according different methods:
Protein with the highest isoelectric point:
>tr|Q6RBY8|Q6RBY8_9VIRU Triple block protein 1 OS=Poplar mosaic virus OX=12166 GN=ORF2 PE=4 SV=1
MM1 pKa = 7.68PLSPPPDD8 pKa = 3.35HH9 pKa = 7.28SKK11 pKa = 9.56TFLVAAAGLSLVLCLYY27 pKa = 9.37TLTRR31 pKa = 11.84STLPGVGDD39 pKa = 4.47NIHH42 pKa = 6.38SLPHH46 pKa = 5.81GGQYY50 pKa = 10.2RR51 pKa = 11.84DD52 pKa = 3.38GTKK55 pKa = 10.35SINYY59 pKa = 7.9CSPGKK64 pKa = 10.32SYY66 pKa = 10.77PSSNLLRR73 pKa = 11.84GGHH76 pKa = 6.09FPALCAILLISGAILISYY94 pKa = 8.18RR95 pKa = 11.84FQPGALSRR103 pKa = 11.84CGVTHH108 pKa = 7.36
MM1 pKa = 7.68PLSPPPDD8 pKa = 3.35HH9 pKa = 7.28SKK11 pKa = 9.56TFLVAAAGLSLVLCLYY27 pKa = 9.37TLTRR31 pKa = 11.84STLPGVGDD39 pKa = 4.47NIHH42 pKa = 6.38SLPHH46 pKa = 5.81GGQYY50 pKa = 10.2RR51 pKa = 11.84DD52 pKa = 3.38GTKK55 pKa = 10.35SINYY59 pKa = 7.9CSPGKK64 pKa = 10.32SYY66 pKa = 10.77PSSNLLRR73 pKa = 11.84GGHH76 pKa = 6.09FPALCAILLISGAILISYY94 pKa = 8.18RR95 pKa = 11.84FQPGALSRR103 pKa = 11.84CGVTHH108 pKa = 7.36
Molecular weight: 11.39 kDa
Isoelectric point according different methods:
Peptides (in silico digests for buttom-up proteomics)
Below you can find in silico digests of the whole proteome with Trypsin, Chymotrypsin, Trypsin+LysC, LysN, ArgC proteases suitable for different mass spec machines.| Try ESI |
 |
|---|
| ChTry ESI |
|
|---|
| ArgC ESI |
|
|---|
| LysN ESI |
|
|---|
| TryLysC ESI |
|
|---|
| Try MALDI |
|
|---|
| ChTry MALDI |
|
|---|
| ArgC MALDI |
|
|---|
| LysN MALDI |
|
|---|
| TryLysC MALDI |
|
|---|
| Try LTQ |
|
|---|
| ChTry LTQ |
|
|---|
| ArgC LTQ |
|
|---|
| LysN LTQ |
|
|---|
| TryLysC LTQ |
|
|---|
| Try MSlow |
|
|---|
| ChTry MSlow |
|
|---|
| ArgC MSlow |
|
|---|
| LysN MSlow |
|
|---|
| TryLysC MSlow |
|
|---|
| Try MShigh |
|
|---|
| ChTry MShigh |
|
|---|
| ArgC MShigh |
|
|---|
| LysN MShigh |
|
|---|
| TryLysC MShigh |
|
|---|
General Statistics
Number of major isoforms |
Number of additional isoforms |
Number of all proteins |
Number of amino acids |
Min. Seq. Length |
Max. Seq. Length |
Avg. Seq. Length |
Avg. Mol. Weight |
|---|---|---|---|---|---|---|---|
0 |
2856 |
71 |
1992 |
476.0 |
53.53 |
Amino acid frequency
Ala |
Cys |
Asp |
Glu |
Phe |
Gly |
His |
Ile |
Lys |
Leu |
|---|---|---|---|---|---|---|---|---|---|
7.353 ± 1.13 | 3.046 ± 0.722 |
4.902 ± 0.416 | 7.143 ± 1.043 |
5.357 ± 0.508 | 6.513 ± 0.558 |
2.486 ± 0.463 | 5.112 ± 0.664 |
6.513 ± 0.902 | 9.174 ± 0.95 |
Met |
Asn |
Gln |
Pro |
Arg |
Ser |
Thr |
Val |
Trp |
Tyr |
|---|---|---|---|---|---|---|---|---|---|
2.381 ± 0.404 | 3.887 ± 0.547 |
4.167 ± 0.612 | 2.556 ± 0.438 |
5.917 ± 0.83 | 7.983 ± 0.733 |
4.587 ± 0.657 | 6.443 ± 0.885 |
1.085 ± 0.199 | 3.396 ± 0.774 |
Most of the basic statistics you can see at this page can be downloaded from this CSV file
See this proteome in:

Proteome-pI is available under Creative Commons Attribution-NoDerivs license, for more details see here
| Reference: Kozlowski LP. Proteome-pI 2.0: Proteome Isoelectric Point Database Update. Nucleic Acids Res. 2021, doi: 10.1093/nar/gkab944 | Contact: Lukasz P. Kozlowski |