Ralstonia pickettii (strain 12J)
Taxonomy: cellular organisms; Bacteria; Proteobacteria; Betaproteobacteria; Burkholderiales; Burkholderiaceae; Ralstonia; Ralstonia pickettii
Average proteome isoelectric point is 6.84
Get precalculated fractions of proteins
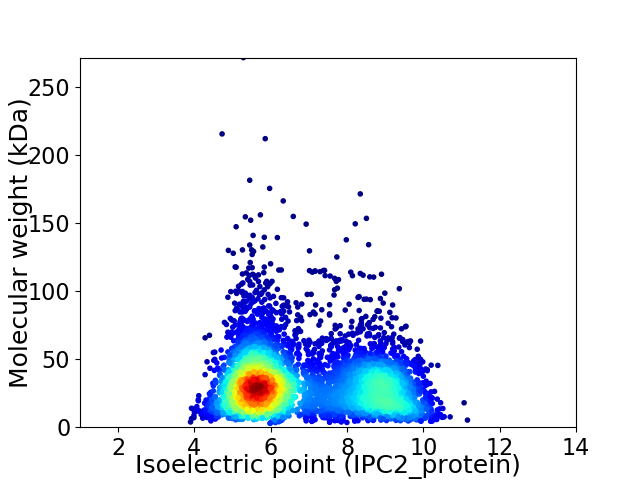
Virtual 2D-PAGE plot for 4890 proteins (isoelectric point calculated using IPC2_protein)
Get csv file with sequences according to given criteria:
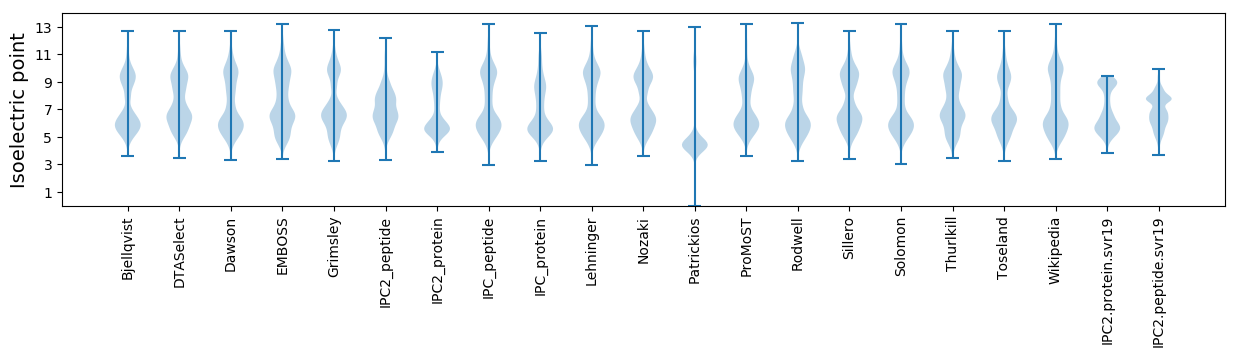
* You can choose from 21 different methods for calculating isoelectric point
Summary statistics related to proteome-wise predictions
Protein with the lowest isoelectric point:
>tr|B2U777|B2U777_RALPJ TfoX domain protein OS=Ralstonia pickettii (strain 12J) OX=402626 GN=Rpic_3659 PE=4 SV=1
MM1 pKa = 7.15EE2 pKa = 3.93QQIEE6 pKa = 4.59YY7 pKa = 8.1KK8 pKa = 9.59TWMCLICGWIYY19 pKa = 11.03DD20 pKa = 4.25EE21 pKa = 4.67EE22 pKa = 4.34QGAPDD27 pKa = 4.95DD28 pKa = 5.22GIAPGTKK35 pKa = 9.07WEE37 pKa = 4.52DD38 pKa = 3.42VPINWTCPEE47 pKa = 3.97CGARR51 pKa = 11.84KK52 pKa = 9.54EE53 pKa = 4.07DD54 pKa = 3.87FEE56 pKa = 4.52MVQII60 pKa = 4.59
MM1 pKa = 7.15EE2 pKa = 3.93QQIEE6 pKa = 4.59YY7 pKa = 8.1KK8 pKa = 9.59TWMCLICGWIYY19 pKa = 11.03DD20 pKa = 4.25EE21 pKa = 4.67EE22 pKa = 4.34QGAPDD27 pKa = 4.95DD28 pKa = 5.22GIAPGTKK35 pKa = 9.07WEE37 pKa = 4.52DD38 pKa = 3.42VPINWTCPEE47 pKa = 3.97CGARR51 pKa = 11.84KK52 pKa = 9.54EE53 pKa = 4.07DD54 pKa = 3.87FEE56 pKa = 4.52MVQII60 pKa = 4.59
Molecular weight: 7.0 kDa
Isoelectric point according different methods:
Protein with the highest isoelectric point:
>tr|B2U855|B2U855_RALPJ Purine nucleoside permease OS=Ralstonia pickettii (strain 12J) OX=402626 GN=Rpic_0746 PE=4 SV=1
MM1 pKa = 7.35KK2 pKa = 9.36RR3 pKa = 11.84TYY5 pKa = 10.06QPSVTRR11 pKa = 11.84RR12 pKa = 11.84KK13 pKa = 8.0RR14 pKa = 11.84THH16 pKa = 5.76GFRR19 pKa = 11.84VRR21 pKa = 11.84MKK23 pKa = 9.39TRR25 pKa = 11.84GGRR28 pKa = 11.84AVLNARR34 pKa = 11.84RR35 pKa = 11.84AKK37 pKa = 9.72GRR39 pKa = 11.84KK40 pKa = 8.85RR41 pKa = 11.84LAII44 pKa = 4.0
MM1 pKa = 7.35KK2 pKa = 9.36RR3 pKa = 11.84TYY5 pKa = 10.06QPSVTRR11 pKa = 11.84RR12 pKa = 11.84KK13 pKa = 8.0RR14 pKa = 11.84THH16 pKa = 5.76GFRR19 pKa = 11.84VRR21 pKa = 11.84MKK23 pKa = 9.39TRR25 pKa = 11.84GGRR28 pKa = 11.84AVLNARR34 pKa = 11.84RR35 pKa = 11.84AKK37 pKa = 9.72GRR39 pKa = 11.84KK40 pKa = 8.85RR41 pKa = 11.84LAII44 pKa = 4.0
Molecular weight: 5.22 kDa
Isoelectric point according different methods:
Peptides (in silico digests for buttom-up proteomics)
Below you can find in silico digests of the whole proteome with Trypsin, Chymotrypsin, Trypsin+LysC, LysN, ArgC proteases suitable for different mass spec machines.| Try ESI |
 |
|---|
| ChTry ESI |
|
|---|
| ArgC ESI |
|
|---|
| LysN ESI |
|
|---|
| TryLysC ESI |
|
|---|
| Try MALDI |
|
|---|
| ChTry MALDI |
|
|---|
| ArgC MALDI |
|
|---|
| LysN MALDI |
|
|---|
| TryLysC MALDI |
|
|---|
| Try LTQ |
|
|---|
| ChTry LTQ |
|
|---|
| ArgC LTQ |
|
|---|
| LysN LTQ |
|
|---|
| TryLysC LTQ |
|
|---|
| Try MSlow |
|
|---|
| ChTry MSlow |
|
|---|
| ArgC MSlow |
|
|---|
| LysN MSlow |
|
|---|
| TryLysC MSlow |
|
|---|
| Try MShigh |
|
|---|
| ChTry MShigh |
|
|---|
| ArgC MShigh |
|
|---|
| LysN MShigh |
|
|---|
| TryLysC MShigh |
|
|---|
General Statistics
Number of major isoforms |
Number of additional isoforms |
Number of all proteins |
Number of amino acids |
Min. Seq. Length |
Max. Seq. Length |
Avg. Seq. Length |
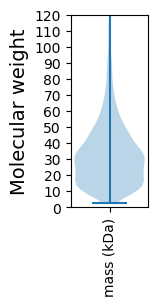
Avg. Mol. Weight |
|---|---|---|---|---|---|---|---|
0 |
1540967 |
24 |
2556 |
315.1 |
34.22 |
Amino acid frequency
Ala |
Cys |
Asp |
Glu |
Phe |
Gly |
His |
Ile |
Lys |
Leu |
|---|---|---|---|---|---|---|---|---|---|
12.828 ± 0.045 | 0.923 ± 0.015 |
5.348 ± 0.023 | 5.084 ± 0.029 |
3.534 ± 0.022 | 8.129 ± 0.034 |
2.363 ± 0.02 | 4.602 ± 0.028 |
3.212 ± 0.029 | 10.275 ± 0.04 |
Met |
Asn |
Gln |
Pro |
Arg |
Ser |
Thr |
Val |
Trp |
Tyr |
|---|---|---|---|---|---|---|---|---|---|
2.502 ± 0.015 | 2.802 ± 0.022 |
5.213 ± 0.024 | 3.867 ± 0.023 |
6.873 ± 0.036 | 5.312 ± 0.026 |
5.585 ± 0.026 | 7.736 ± 0.031 |
1.426 ± 0.017 | 2.388 ± 0.018 |
Most of the basic statistics you can see at this page can be downloaded from this CSV file
See this proteome in:

Proteome-pI is available under Creative Commons Attribution-NoDerivs license, for more details see here
| Reference: Kozlowski LP. Proteome-pI 2.0: Proteome Isoelectric Point Database Update. Nucleic Acids Res. 2021, doi: 10.1093/nar/gkab944 | Contact: Lukasz P. Kozlowski |