Mycobacterium phage MissWhite
Taxonomy: Viruses; Duplodnaviria; Heunggongvirae; Uroviricota; Caudoviricetes; Caudovirales; Siphoviridae; Fromanvirus; unclassified Fromanvirus
Average proteome isoelectric point is 5.99
Get precalculated fractions of proteins
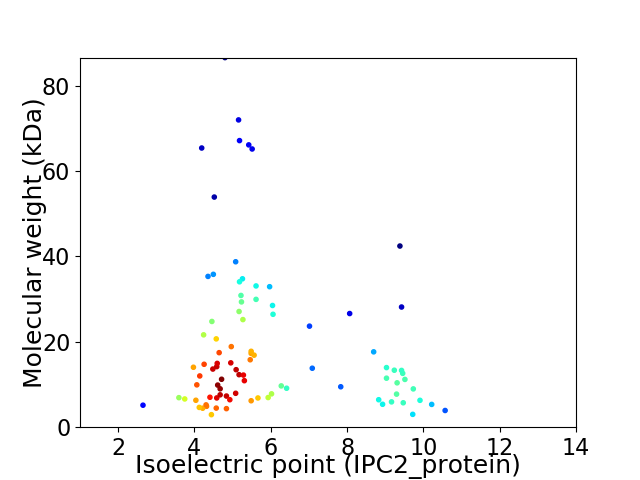
Virtual 2D-PAGE plot for 92 proteins (isoelectric point calculated using IPC2_protein)
Get csv file with sequences according to given criteria:
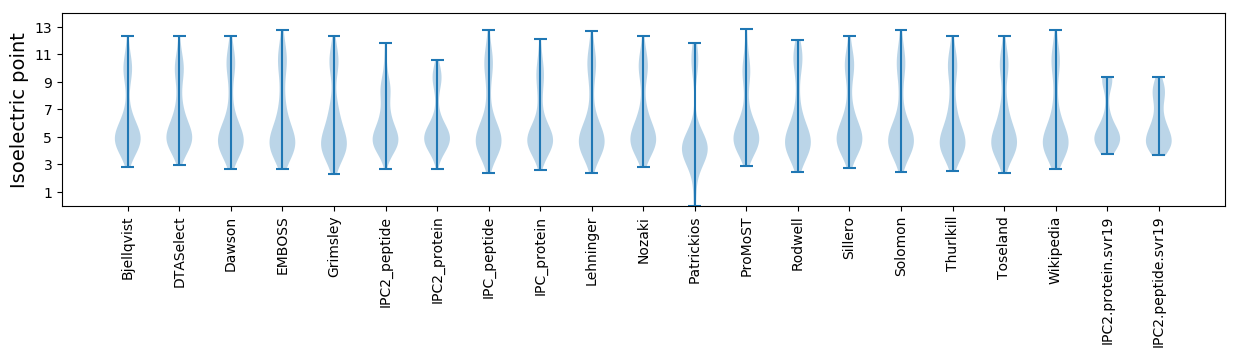
* You can choose from 21 different methods for calculating isoelectric point
Summary statistics related to proteome-wise predictions
Protein with the lowest isoelectric point:
>tr|A0A249XTB0|A0A249XTB0_9CAUD Uncharacterized protein OS=Mycobacterium phage MissWhite OX=2024297 GN=61 PE=4 SV=1
MM1 pKa = 7.41AQRR4 pKa = 11.84ATAINMQDD12 pKa = 3.24RR13 pKa = 11.84FIVCAGEE20 pKa = 4.09PMLDD24 pKa = 3.28TDD26 pKa = 4.19EE27 pKa = 4.7GVLIIQFEE35 pKa = 4.6DD36 pKa = 3.3GTNRR40 pKa = 11.84IFNWDD45 pKa = 3.94YY46 pKa = 11.06IIDD49 pKa = 4.04YY50 pKa = 11.11YY51 pKa = 11.85YY52 pKa = 8.52MTEE55 pKa = 4.05DD56 pKa = 3.14
MM1 pKa = 7.41AQRR4 pKa = 11.84ATAINMQDD12 pKa = 3.24RR13 pKa = 11.84FIVCAGEE20 pKa = 4.09PMLDD24 pKa = 3.28TDD26 pKa = 4.19EE27 pKa = 4.7GVLIIQFEE35 pKa = 4.6DD36 pKa = 3.3GTNRR40 pKa = 11.84IFNWDD45 pKa = 3.94YY46 pKa = 11.06IIDD49 pKa = 4.04YY50 pKa = 11.11YY51 pKa = 11.85YY52 pKa = 8.52MTEE55 pKa = 4.05DD56 pKa = 3.14
Molecular weight: 6.62 kDa
Isoelectric point according different methods:
Protein with the highest isoelectric point:
>tr|A0A249XTB9|A0A249XTB9_9CAUD Glutaredoxin OS=Mycobacterium phage MissWhite OX=2024297 GN=57 PE=4 SV=1
MM1 pKa = 7.3KK2 pKa = 9.91WGVRR6 pKa = 11.84YY7 pKa = 8.69PRR9 pKa = 11.84SGIHH13 pKa = 5.54EE14 pKa = 4.47CPFGFKK20 pKa = 9.1QASMIEE26 pKa = 3.89LLAIRR31 pKa = 11.84NGVRR35 pKa = 11.84AQLVSSSDD43 pKa = 3.53GGQTWVTRR51 pKa = 3.96
MM1 pKa = 7.3KK2 pKa = 9.91WGVRR6 pKa = 11.84YY7 pKa = 8.69PRR9 pKa = 11.84SGIHH13 pKa = 5.54EE14 pKa = 4.47CPFGFKK20 pKa = 9.1QASMIEE26 pKa = 3.89LLAIRR31 pKa = 11.84NGVRR35 pKa = 11.84AQLVSSSDD43 pKa = 3.53GGQTWVTRR51 pKa = 3.96
Molecular weight: 5.72 kDa
Isoelectric point according different methods:
Peptides (in silico digests for buttom-up proteomics)
Below you can find in silico digests of the whole proteome with Trypsin, Chymotrypsin, Trypsin+LysC, LysN, ArgC proteases suitable for different mass spec machines.| Try ESI |
 |
|---|
| ChTry ESI |
|
|---|
| ArgC ESI |
|
|---|
| LysN ESI |
|
|---|
| TryLysC ESI |
|
|---|
| Try MALDI |
|
|---|
| ChTry MALDI |
|
|---|
| ArgC MALDI |
|
|---|
| LysN MALDI |
|
|---|
| TryLysC MALDI |
|
|---|
| Try LTQ |
|
|---|
| ChTry LTQ |
|
|---|
| ArgC LTQ |
|
|---|
| LysN LTQ |
|
|---|
| TryLysC LTQ |
|
|---|
| Try MSlow |
|
|---|
| ChTry MSlow |
|
|---|
| ArgC MSlow |
|
|---|
| LysN MSlow |
|
|---|
| TryLysC MSlow |
|
|---|
| Try MShigh |
|
|---|
| ChTry MShigh |
|
|---|
| ArgC MShigh |
|
|---|
| LysN MShigh |
|
|---|
| TryLysC MShigh |
|
|---|
General Statistics
Number of major isoforms |
Number of additional isoforms |
Number of all proteins |
Number of amino acids |
Min. Seq. Length |
Max. Seq. Length |
Avg. Seq. Length |
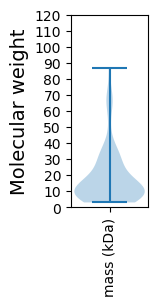
Avg. Mol. Weight |
|---|---|---|---|---|---|---|---|
0 |
15603 |
24 |
835 |
169.6 |
18.8 |
Amino acid frequency
Ala |
Cys |
Asp |
Glu |
Phe |
Gly |
His |
Ile |
Lys |
Leu |
|---|---|---|---|---|---|---|---|---|---|
9.876 ± 0.316 | 0.987 ± 0.115 |
6.614 ± 0.224 | 7.088 ± 0.288 |
3.448 ± 0.192 | 8.197 ± 0.393 |
2.07 ± 0.172 | 4.986 ± 0.179 |
4.384 ± 0.263 | 7.973 ± 0.397 |
Met |
Asn |
Gln |
Pro |
Arg |
Ser |
Thr |
Val |
Trp |
Tyr |
|---|---|---|---|---|---|---|---|---|---|
2.615 ± 0.165 | 3.358 ± 0.185 |
5.287 ± 0.227 | 3.583 ± 0.186 |
6.588 ± 0.438 | 5.012 ± 0.217 |
5.992 ± 0.302 | 7.095 ± 0.224 |
1.974 ± 0.146 | 2.871 ± 0.189 |
Most of the basic statistics you can see at this page can be downloaded from this CSV file
See this proteome in:

Proteome-pI is available under Creative Commons Attribution-NoDerivs license, for more details see here
| Reference: Kozlowski LP. Proteome-pI 2.0: Proteome Isoelectric Point Database Update. Nucleic Acids Res. 2021, doi: 10.1093/nar/gkab944 | Contact: Lukasz P. Kozlowski |