Acinetobacter rudis CIP 110305
Taxonomy: cellular organisms; Bacteria; Proteobacteria; Gammaproteobacteria; Pseudomonadales; Moraxellaceae; Acinetobacter; Acinetobacter rudis
Average proteome isoelectric point is 6.48
Get precalculated fractions of proteins
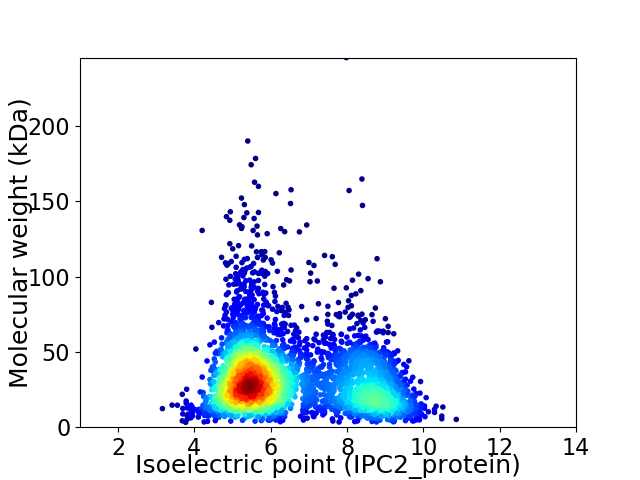
Virtual 2D-PAGE plot for 3609 proteins (isoelectric point calculated using IPC2_protein)
Get csv file with sequences according to given criteria:
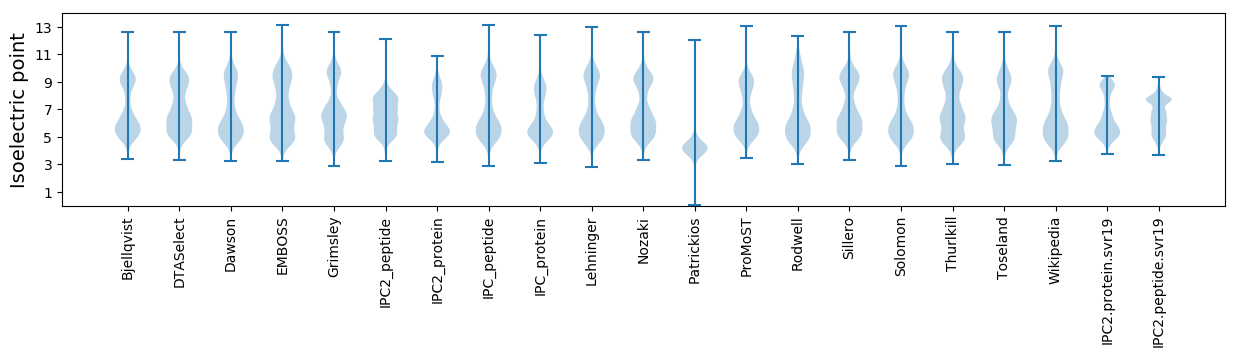
* You can choose from 21 different methods for calculating isoelectric point
Summary statistics related to proteome-wise predictions
Protein with the lowest isoelectric point:
>tr|S3NHV0|S3NHV0_9GAMM 3-oxoadipate enol-lactonase OS=Acinetobacter rudis CIP 110305 OX=421052 GN=F945_01808 PE=4 SV=1
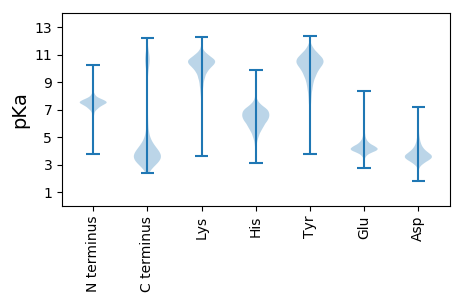
MM1 pKa = 7.56VNLQMEE7 pKa = 4.72GFEE10 pKa = 4.26VVLWILGVLFGSVVIIGSVLLSTAIYY36 pKa = 8.43TKK38 pKa = 10.09RR39 pKa = 11.84LKK41 pKa = 10.52IIDD44 pKa = 3.83QQATASEE51 pKa = 4.17DD52 pKa = 3.97RR53 pKa = 11.84YY54 pKa = 11.53NSMPWHH60 pKa = 6.07VMNGDD65 pKa = 3.36QDD67 pKa = 3.85VSSSQDD73 pKa = 3.11SYY75 pKa = 11.82SSCDD79 pKa = 3.55TQSSDD84 pKa = 4.79SSSCDD89 pKa = 3.15SSSSSDD95 pKa = 3.01
MM1 pKa = 7.56VNLQMEE7 pKa = 4.72GFEE10 pKa = 4.26VVLWILGVLFGSVVIIGSVLLSTAIYY36 pKa = 8.43TKK38 pKa = 10.09RR39 pKa = 11.84LKK41 pKa = 10.52IIDD44 pKa = 3.83QQATASEE51 pKa = 4.17DD52 pKa = 3.97RR53 pKa = 11.84YY54 pKa = 11.53NSMPWHH60 pKa = 6.07VMNGDD65 pKa = 3.36QDD67 pKa = 3.85VSSSQDD73 pKa = 3.11SYY75 pKa = 11.82SSCDD79 pKa = 3.55TQSSDD84 pKa = 4.79SSSCDD89 pKa = 3.15SSSSSDD95 pKa = 3.01
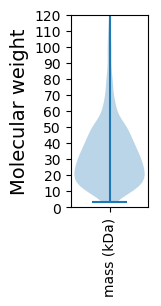
Molecular weight: 10.34 kDa
Isoelectric point according different methods:
Protein with the highest isoelectric point:
>tr|S3MQ38|S3MQ38_9GAMM Pantothenate synthetase OS=Acinetobacter rudis CIP 110305 OX=421052 GN=panC PE=3 SV=1
MM1 pKa = 7.45KK2 pKa = 9.55RR3 pKa = 11.84TFQPSEE9 pKa = 3.97LKK11 pKa = 10.13RR12 pKa = 11.84KK13 pKa = 8.98RR14 pKa = 11.84VHH16 pKa = 6.36GFRR19 pKa = 11.84ARR21 pKa = 11.84MATKK25 pKa = 10.4AGRR28 pKa = 11.84QVLARR33 pKa = 11.84RR34 pKa = 11.84RR35 pKa = 11.84AKK37 pKa = 10.18GRR39 pKa = 11.84HH40 pKa = 5.1SLTVV44 pKa = 3.06
MM1 pKa = 7.45KK2 pKa = 9.55RR3 pKa = 11.84TFQPSEE9 pKa = 3.97LKK11 pKa = 10.13RR12 pKa = 11.84KK13 pKa = 8.98RR14 pKa = 11.84VHH16 pKa = 6.36GFRR19 pKa = 11.84ARR21 pKa = 11.84MATKK25 pKa = 10.4AGRR28 pKa = 11.84QVLARR33 pKa = 11.84RR34 pKa = 11.84RR35 pKa = 11.84AKK37 pKa = 10.18GRR39 pKa = 11.84HH40 pKa = 5.1SLTVV44 pKa = 3.06
Molecular weight: 5.18 kDa
Isoelectric point according different methods:
Peptides (in silico digests for buttom-up proteomics)
Below you can find in silico digests of the whole proteome with Trypsin, Chymotrypsin, Trypsin+LysC, LysN, ArgC proteases suitable for different mass spec machines.| Try ESI |
 |
|---|
| ChTry ESI |
|
|---|
| ArgC ESI |
|
|---|
| LysN ESI |
|
|---|
| TryLysC ESI |
|
|---|
| Try MALDI |
|
|---|
| ChTry MALDI |
|
|---|
| ArgC MALDI |
|
|---|
| LysN MALDI |
|
|---|
| TryLysC MALDI |
|
|---|
| Try LTQ |
|
|---|
| ChTry LTQ |
|
|---|
| ArgC LTQ |
|
|---|
| LysN LTQ |
|
|---|
| TryLysC LTQ |
|
|---|
| Try MSlow |
|
|---|
| ChTry MSlow |
|
|---|
| ArgC MSlow |
|
|---|
| LysN MSlow |
|
|---|
| TryLysC MSlow |
|
|---|
| Try MShigh |
|
|---|
| ChTry MShigh |
|
|---|
| ArgC MShigh |
|
|---|
| LysN MShigh |
|
|---|
| TryLysC MShigh |
|
|---|
General Statistics
Number of major isoforms |
Number of additional isoforms |
Number of all proteins |
Number of amino acids |
Min. Seq. Length |
Max. Seq. Length |
Avg. Seq. Length |
Avg. Mol. Weight |
|---|---|---|---|---|---|---|---|
0 |
1134487 |
26 |
2311 |
314.3 |
35.13 |
Amino acid frequency
Ala |
Cys |
Asp |
Glu |
Phe |
Gly |
His |
Ile |
Lys |
Leu |
|---|---|---|---|---|---|---|---|---|---|
8.69 ± 0.051 | 1.006 ± 0.012 |
5.125 ± 0.031 | 5.6 ± 0.039 |
4.269 ± 0.029 | 6.337 ± 0.038 |
2.451 ± 0.022 | 6.976 ± 0.036 |
5.392 ± 0.034 | 10.607 ± 0.054 |
Met |
Asn |
Gln |
Pro |
Arg |
Ser |
Thr |
Val |
Trp |
Tyr |
|---|---|---|---|---|---|---|---|---|---|
2.477 ± 0.02 | 4.441 ± 0.035 |
3.772 ± 0.024 | 5.839 ± 0.044 |
4.285 ± 0.03 | 6.381 ± 0.029 |
5.152 ± 0.026 | 6.542 ± 0.036 |
1.276 ± 0.015 | 3.383 ± 0.028 |
Most of the basic statistics you can see at this page can be downloaded from this CSV file
See this proteome in:

Proteome-pI is available under Creative Commons Attribution-NoDerivs license, for more details see here
| Reference: Kozlowski LP. Proteome-pI 2.0: Proteome Isoelectric Point Database Update. Nucleic Acids Res. 2021, doi: 10.1093/nar/gkab944 | Contact: Lukasz P. Kozlowski |