Hephaestia caeni
Taxonomy: cellular organisms; Bacteria; Proteobacteria; Alphaproteobacteria; Sphingomonadales; Sphingomonadaceae; Hephaestia
Average proteome isoelectric point is 6.55
Get precalculated fractions of proteins
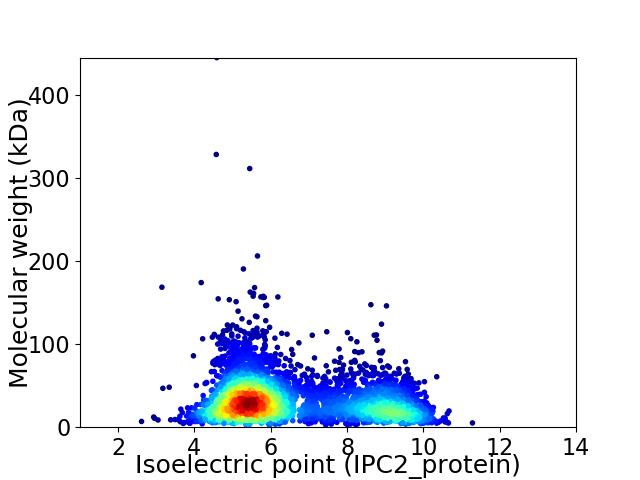
Virtual 2D-PAGE plot for 4251 proteins (isoelectric point calculated using IPC2_protein)
Get csv file with sequences according to given criteria:
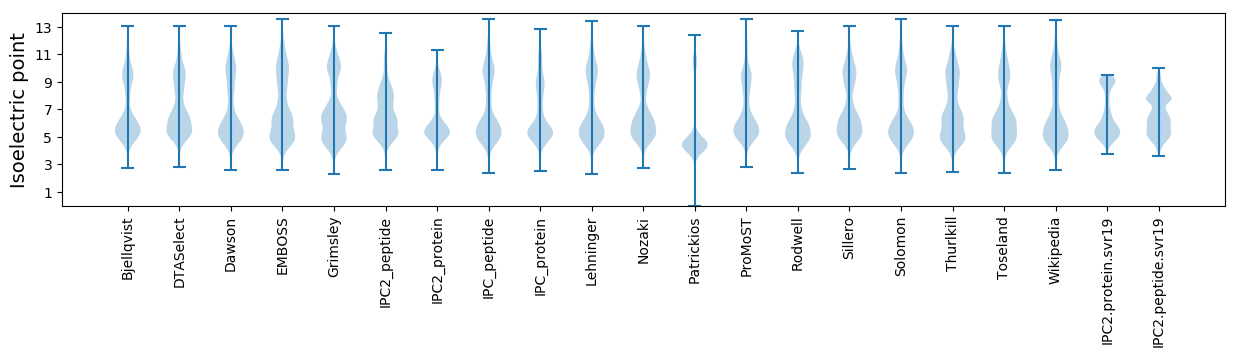
* You can choose from 21 different methods for calculating isoelectric point
Summary statistics related to proteome-wise predictions
Protein with the lowest isoelectric point:
>tr|A0A397P5N3|A0A397P5N3_9SPHN Two-component system response regulator RegA OS=Hephaestia caeni OX=645617 GN=DFR49_1775 PE=4 SV=1
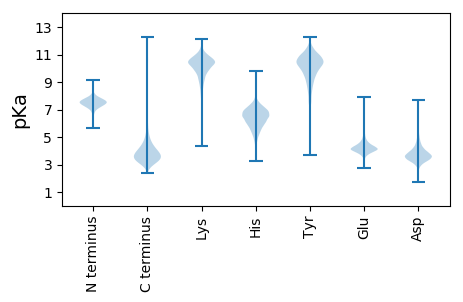
MM1 pKa = 7.26VPLPGQEE8 pKa = 4.17PYY10 pKa = 10.86IMPLTTAQSFAWNLAKK26 pKa = 9.9TLMTIIVLIEE36 pKa = 3.66TDD38 pKa = 3.08RR39 pKa = 11.84GYY41 pKa = 11.62VAMPSDD47 pKa = 4.56EE48 pKa = 4.67FDD50 pKa = 3.95GDD52 pKa = 3.76PDD54 pKa = 5.3RR55 pKa = 11.84IICEE59 pKa = 3.93YY60 pKa = 11.08DD61 pKa = 2.74PWSS64 pKa = 3.41
MM1 pKa = 7.26VPLPGQEE8 pKa = 4.17PYY10 pKa = 10.86IMPLTTAQSFAWNLAKK26 pKa = 9.9TLMTIIVLIEE36 pKa = 3.66TDD38 pKa = 3.08RR39 pKa = 11.84GYY41 pKa = 11.62VAMPSDD47 pKa = 4.56EE48 pKa = 4.67FDD50 pKa = 3.95GDD52 pKa = 3.76PDD54 pKa = 5.3RR55 pKa = 11.84IICEE59 pKa = 3.93YY60 pKa = 11.08DD61 pKa = 2.74PWSS64 pKa = 3.41
Molecular weight: 7.26 kDa
Isoelectric point according different methods:
Protein with the highest isoelectric point:
>tr|A0A397NH55|A0A397NH55_9SPHN Translation initiation factor IF-1 OS=Hephaestia caeni OX=645617 GN=infA PE=3 SV=1
MM1 pKa = 7.45KK2 pKa = 9.61RR3 pKa = 11.84TFQPSNLVRR12 pKa = 11.84ARR14 pKa = 11.84RR15 pKa = 11.84HH16 pKa = 4.58GFRR19 pKa = 11.84SRR21 pKa = 11.84MATPGGRR28 pKa = 11.84KK29 pKa = 9.14VIRR32 pKa = 11.84ARR34 pKa = 11.84RR35 pKa = 11.84ARR37 pKa = 11.84GRR39 pKa = 11.84KK40 pKa = 9.02KK41 pKa = 10.61LSAA44 pKa = 4.03
MM1 pKa = 7.45KK2 pKa = 9.61RR3 pKa = 11.84TFQPSNLVRR12 pKa = 11.84ARR14 pKa = 11.84RR15 pKa = 11.84HH16 pKa = 4.58GFRR19 pKa = 11.84SRR21 pKa = 11.84MATPGGRR28 pKa = 11.84KK29 pKa = 9.14VIRR32 pKa = 11.84ARR34 pKa = 11.84RR35 pKa = 11.84ARR37 pKa = 11.84GRR39 pKa = 11.84KK40 pKa = 9.02KK41 pKa = 10.61LSAA44 pKa = 4.03
Molecular weight: 5.12 kDa
Isoelectric point according different methods:
Peptides (in silico digests for buttom-up proteomics)
Below you can find in silico digests of the whole proteome with Trypsin, Chymotrypsin, Trypsin+LysC, LysN, ArgC proteases suitable for different mass spec machines.| Try ESI |
 |
|---|
| ChTry ESI |
|
|---|
| ArgC ESI |
|
|---|
| LysN ESI |
|
|---|
| TryLysC ESI |
|
|---|
| Try MALDI |
|
|---|
| ChTry MALDI |
|
|---|
| ArgC MALDI |
|
|---|
| LysN MALDI |
|
|---|
| TryLysC MALDI |
|
|---|
| Try LTQ |
|
|---|
| ChTry LTQ |
|
|---|
| ArgC LTQ |
|
|---|
| LysN LTQ |
|
|---|
| TryLysC LTQ |
|
|---|
| Try MSlow |
|
|---|
| ChTry MSlow |
|
|---|
| ArgC MSlow |
|
|---|
| LysN MSlow |
|
|---|
| TryLysC MSlow |
|
|---|
| Try MShigh |
|
|---|
| ChTry MShigh |
|
|---|
| ArgC MShigh |
|
|---|
| LysN MShigh |
|
|---|
| TryLysC MShigh |
|
|---|
General Statistics
Number of major isoforms |
Number of additional isoforms |
Number of all proteins |
Number of amino acids |
Min. Seq. Length |
Max. Seq. Length |
Avg. Seq. Length |
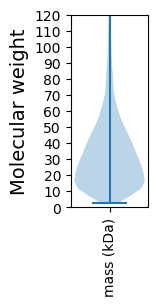
Avg. Mol. Weight |
|---|---|---|---|---|---|---|---|
0 |
1356717 |
27 |
4338 |
319.2 |
34.42 |
Amino acid frequency
Ala |
Cys |
Asp |
Glu |
Phe |
Gly |
His |
Ile |
Lys |
Leu |
|---|---|---|---|---|---|---|---|---|---|
13.834 ± 0.055 | 0.738 ± 0.011 |
6.269 ± 0.029 | 5.14 ± 0.037 |
3.468 ± 0.026 | 8.837 ± 0.044 |
2.051 ± 0.017 | 5.123 ± 0.024 |
2.736 ± 0.027 | 9.756 ± 0.036 |
Met |
Asn |
Gln |
Pro |
Arg |
Ser |
Thr |
Val |
Trp |
Tyr |
|---|---|---|---|---|---|---|---|---|---|
2.278 ± 0.017 | 2.427 ± 0.027 |
5.466 ± 0.028 | 2.952 ± 0.023 |
7.601 ± 0.042 | 5.018 ± 0.028 |
5.527 ± 0.031 | 7.105 ± 0.029 |
1.448 ± 0.015 | 2.226 ± 0.022 |
Most of the basic statistics you can see at this page can be downloaded from this CSV file
See this proteome in:

Proteome-pI is available under Creative Commons Attribution-NoDerivs license, for more details see here
| Reference: Kozlowski LP. Proteome-pI 2.0: Proteome Isoelectric Point Database Update. Nucleic Acids Res. 2021, doi: 10.1093/nar/gkab944 | Contact: Lukasz P. Kozlowski |