Paenibacillus protaetiae
Taxonomy: cellular organisms; Bacteria; Terrabacteria group; Firmicutes; Bacilli; Bacillales; Paenibacillaceae; Paenibacillus
Average proteome isoelectric point is 6.35
Get precalculated fractions of proteins
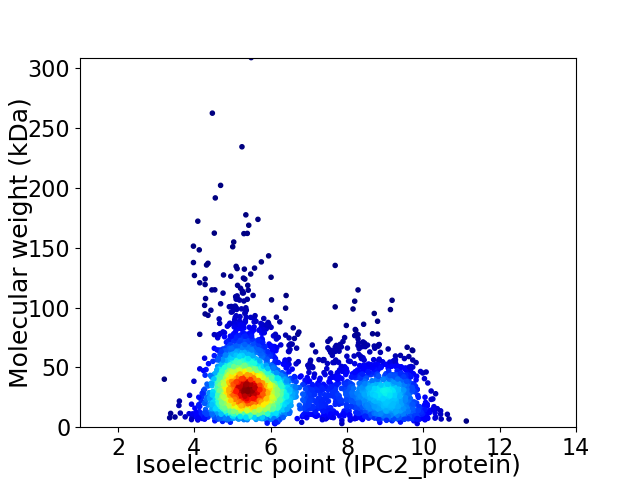
Virtual 2D-PAGE plot for 3615 proteins (isoelectric point calculated using IPC2_protein)
Get csv file with sequences according to given criteria:
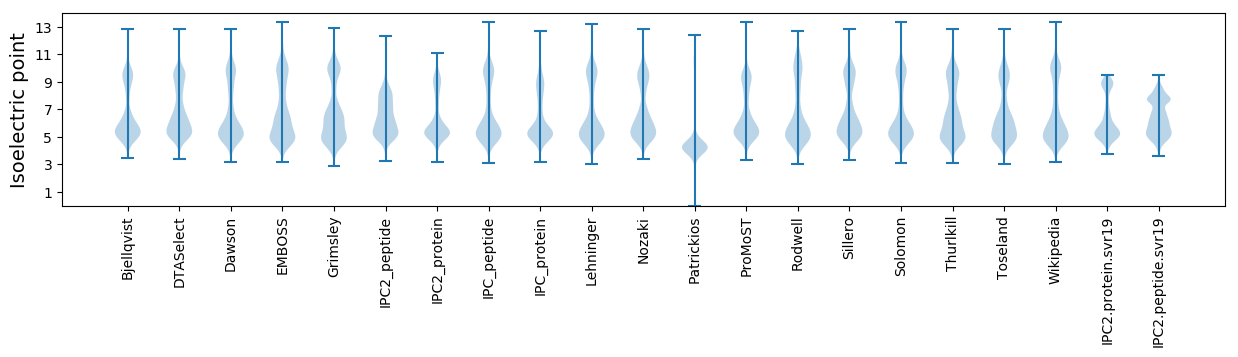
* You can choose from 21 different methods for calculating isoelectric point
Summary statistics related to proteome-wise predictions
Protein with the lowest isoelectric point:
>tr|A0A4P6EW82|A0A4P6EW82_9BACL Uncharacterized protein OS=Paenibacillus protaetiae OX=2509456 GN=ET464_11615 PE=4 SV=1
MM1 pKa = 6.91YY2 pKa = 9.48CVCKK6 pKa = 10.55GHH8 pKa = 6.79VEE10 pKa = 3.82LAIDD14 pKa = 3.54KK15 pKa = 10.59FVDD18 pKa = 3.68EE19 pKa = 5.73FEE21 pKa = 4.75DD22 pKa = 4.43APDD25 pKa = 3.54IVDD28 pKa = 3.86LNKK31 pKa = 10.51TEE33 pKa = 4.09FADD36 pKa = 3.59WDD38 pKa = 3.87PPRR41 pKa = 11.84CCDD44 pKa = 3.98LCEE47 pKa = 4.0QNAEE51 pKa = 4.13FLVVV55 pKa = 3.51
MM1 pKa = 6.91YY2 pKa = 9.48CVCKK6 pKa = 10.55GHH8 pKa = 6.79VEE10 pKa = 3.82LAIDD14 pKa = 3.54KK15 pKa = 10.59FVDD18 pKa = 3.68EE19 pKa = 5.73FEE21 pKa = 4.75DD22 pKa = 4.43APDD25 pKa = 3.54IVDD28 pKa = 3.86LNKK31 pKa = 10.51TEE33 pKa = 4.09FADD36 pKa = 3.59WDD38 pKa = 3.87PPRR41 pKa = 11.84CCDD44 pKa = 3.98LCEE47 pKa = 4.0QNAEE51 pKa = 4.13FLVVV55 pKa = 3.51
Molecular weight: 6.34 kDa
Isoelectric point according different methods:
Protein with the highest isoelectric point:
>tr|A0A4P6EZ03|A0A4P6EZ03_9BACL Carbohydrate ABC transporter permease OS=Paenibacillus protaetiae OX=2509456 GN=ET464_12125 PE=3 SV=1
MM1 pKa = 7.9RR2 pKa = 11.84PTFKK6 pKa = 10.82PNVSKK11 pKa = 10.8RR12 pKa = 11.84KK13 pKa = 8.95KK14 pKa = 8.25VHH16 pKa = 5.49GFRR19 pKa = 11.84KK20 pKa = 10.01RR21 pKa = 11.84MSTKK25 pKa = 10.18NGRR28 pKa = 11.84KK29 pKa = 8.78VLAARR34 pKa = 11.84RR35 pKa = 11.84QKK37 pKa = 10.23GRR39 pKa = 11.84KK40 pKa = 8.56VLSAA44 pKa = 4.05
MM1 pKa = 7.9RR2 pKa = 11.84PTFKK6 pKa = 10.82PNVSKK11 pKa = 10.8RR12 pKa = 11.84KK13 pKa = 8.95KK14 pKa = 8.25VHH16 pKa = 5.49GFRR19 pKa = 11.84KK20 pKa = 10.01RR21 pKa = 11.84MSTKK25 pKa = 10.18NGRR28 pKa = 11.84KK29 pKa = 8.78VLAARR34 pKa = 11.84RR35 pKa = 11.84QKK37 pKa = 10.23GRR39 pKa = 11.84KK40 pKa = 8.56VLSAA44 pKa = 4.05
Molecular weight: 5.14 kDa
Isoelectric point according different methods:
Peptides (in silico digests for buttom-up proteomics)
Below you can find in silico digests of the whole proteome with Trypsin, Chymotrypsin, Trypsin+LysC, LysN, ArgC proteases suitable for different mass spec machines.| Try ESI |
 |
|---|
| ChTry ESI |
|
|---|
| ArgC ESI |
|
|---|
| LysN ESI |
|
|---|
| TryLysC ESI |
|
|---|
| Try MALDI |
|
|---|
| ChTry MALDI |
|
|---|
| ArgC MALDI |
|
|---|
| LysN MALDI |
|
|---|
| TryLysC MALDI |
|
|---|
| Try LTQ |
|
|---|
| ChTry LTQ |
|
|---|
| ArgC LTQ |
|
|---|
| LysN LTQ |
|
|---|
| TryLysC LTQ |
|
|---|
| Try MSlow |
|
|---|
| ChTry MSlow |
|
|---|
| ArgC MSlow |
|
|---|
| LysN MSlow |
|
|---|
| TryLysC MSlow |
|
|---|
| Try MShigh |
|
|---|
| ChTry MShigh |
|
|---|
| ArgC MShigh |
|
|---|
| LysN MShigh |
|
|---|
| TryLysC MShigh |
|
|---|
General Statistics
Number of major isoforms |
Number of additional isoforms |
Number of all proteins |
Number of amino acids |
Min. Seq. Length |
Max. Seq. Length |
Avg. Seq. Length |
Avg. Mol. Weight |
|---|---|---|---|---|---|---|---|
0 |
1155770 |
25 |
2793 |
319.7 |
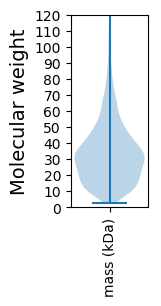
35.4 |
Amino acid frequency
Ala |
Cys |
Asp |
Glu |
Phe |
Gly |
His |
Ile |
Lys |
Leu |
|---|---|---|---|---|---|---|---|---|---|
9.306 ± 0.058 | 0.733 ± 0.012 |
5.158 ± 0.03 | 6.536 ± 0.04 |
3.944 ± 0.029 | 7.699 ± 0.039 |
2.111 ± 0.019 | 6.39 ± 0.04 |
5.142 ± 0.035 | 9.996 ± 0.05 |
Met |
Asn |
Gln |
Pro |
Arg |
Ser |
Thr |
Val |
Trp |
Tyr |
|---|---|---|---|---|---|---|---|---|---|
2.747 ± 0.025 | 3.611 ± 0.033 |
4.22 ± 0.028 | 4.005 ± 0.025 |
5.179 ± 0.039 | 6.229 ± 0.031 |
5.247 ± 0.039 | 7.066 ± 0.035 |
1.252 ± 0.018 | 3.427 ± 0.024 |
Most of the basic statistics you can see at this page can be downloaded from this CSV file
See this proteome in:

Proteome-pI is available under Creative Commons Attribution-NoDerivs license, for more details see here
| Reference: Kozlowski LP. Proteome-pI 2.0: Proteome Isoelectric Point Database Update. Nucleic Acids Res. 2021, doi: 10.1093/nar/gkab944 | Contact: Lukasz P. Kozlowski |