Bat coronavirus 279/2005 (BtCoV) (BtCoV/279/2005)
Taxonomy: Viruses; Riboviria; Orthornavirae; Pisuviricota; Pisoniviricetes; Nidovirales; Cornidovirineae; Coronaviridae; Orthocoronavirinae; Betacoronavirus; Sarbecovirus; Severe acute respiratory syndrome-related coronavirus; Bat SARS CoV Rm1/2004
Average proteome isoelectric point is 6.12
Get precalculated fractions of proteins
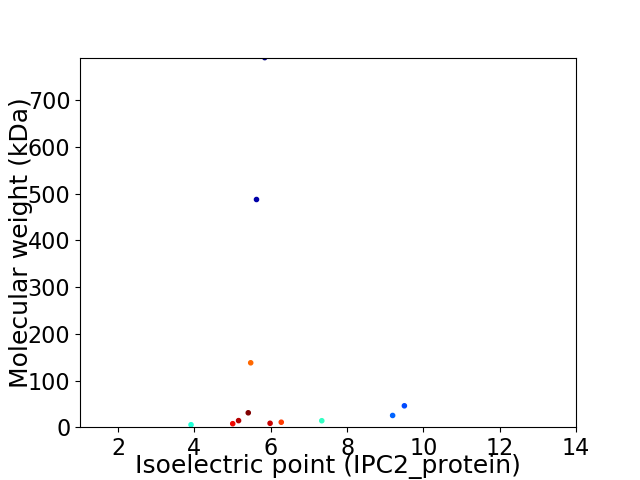
Virtual 2D-PAGE plot for 12 proteins (isoelectric point calculated using IPC2_protein)
Get csv file with sequences according to given criteria:
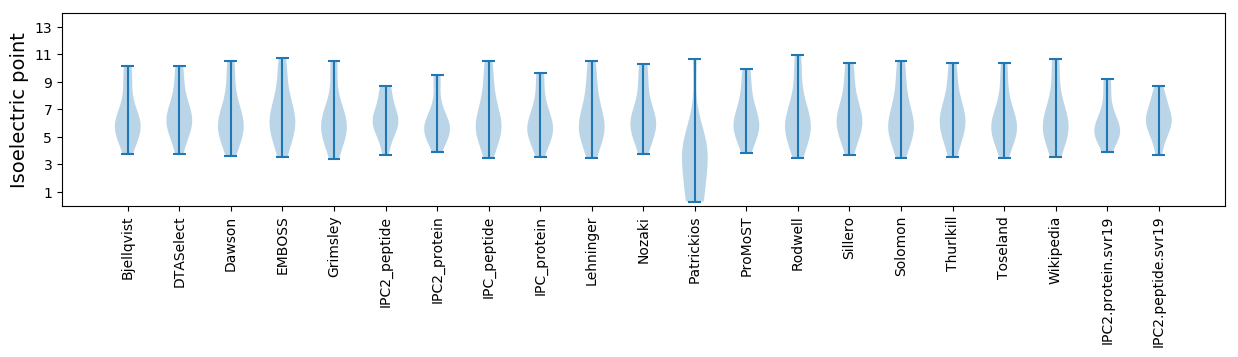
* You can choose from 21 different methods for calculating isoelectric point
Summary statistics related to proteome-wise predictions
Protein with the lowest isoelectric point:
>sp|P0C6F5|R1A_BC279 Replicase polyprotein 1a OS=Bat coronavirus 279/2005 OX=389167 GN=1a PE=3 SV=1
MM1 pKa = 7.71NEE3 pKa = 3.36LTLIDD8 pKa = 5.36FYY10 pKa = 11.69LCFLAFLLFLVLIMLIIFWFSLEE33 pKa = 4.06LQDD36 pKa = 5.95IEE38 pKa = 4.55EE39 pKa = 4.77PCNKK43 pKa = 9.46VV44 pKa = 2.79
MM1 pKa = 7.71NEE3 pKa = 3.36LTLIDD8 pKa = 5.36FYY10 pKa = 11.69LCFLAFLLFLVLIMLIIFWFSLEE33 pKa = 4.06LQDD36 pKa = 5.95IEE38 pKa = 4.55EE39 pKa = 4.77PCNKK43 pKa = 9.46VV44 pKa = 2.79
Molecular weight: 5.32 kDa
Isoelectric point according different methods:
Protein with the highest isoelectric point:
>sp|Q0Q469|NS8_BC279 Non-structural protein 8 OS=Bat coronavirus 279/2005 OX=389167 GN=8 PE=3 SV=1
MM1 pKa = 7.77SDD3 pKa = 4.56NGPQNQRR10 pKa = 11.84SAPRR14 pKa = 11.84ITFGGPSDD22 pKa = 3.8STDD25 pKa = 3.04NNQDD29 pKa = 3.07GGRR32 pKa = 11.84SGARR36 pKa = 11.84PKK38 pKa = 10.25QRR40 pKa = 11.84RR41 pKa = 11.84PQGLPNNTASWFTALTQHH59 pKa = 6.06GKK61 pKa = 10.36EE62 pKa = 3.96EE63 pKa = 4.07LRR65 pKa = 11.84FPRR68 pKa = 11.84GQGVPINTNSGKK80 pKa = 10.01DD81 pKa = 3.58DD82 pKa = 3.56QIGYY86 pKa = 8.17YY87 pKa = 9.92RR88 pKa = 11.84RR89 pKa = 11.84ATRR92 pKa = 11.84RR93 pKa = 11.84VRR95 pKa = 11.84GGDD98 pKa = 3.05GKK100 pKa = 10.01MKK102 pKa = 10.32KK103 pKa = 10.19LSPRR107 pKa = 11.84WYY109 pKa = 9.82FYY111 pKa = 11.5YY112 pKa = 10.73LGTGPEE118 pKa = 3.63ASLPYY123 pKa = 9.9GANKK127 pKa = 9.97EE128 pKa = 4.24GIVWVATEE136 pKa = 4.37GALNTPKK143 pKa = 10.91DD144 pKa = 4.0HH145 pKa = 7.46IGTRR149 pKa = 11.84NPNNNAAIVLQLPQGTTLPKK169 pKa = 10.34GFYY172 pKa = 10.67AEE174 pKa = 4.5GSRR177 pKa = 11.84GGSQASSRR185 pKa = 11.84SSSRR189 pKa = 11.84SRR191 pKa = 11.84GNSRR195 pKa = 11.84NSTPGSSRR203 pKa = 11.84GNSPARR209 pKa = 11.84MASGSGEE216 pKa = 3.99TALALLLLDD225 pKa = 4.89RR226 pKa = 11.84LNQLEE231 pKa = 4.58SKK233 pKa = 10.86VSGKK237 pKa = 10.04GQQQQGQTVTKK248 pKa = 9.98KK249 pKa = 10.44SAAEE253 pKa = 3.73ASKK256 pKa = 10.76KK257 pKa = 9.61PRR259 pKa = 11.84QKK261 pKa = 9.55RR262 pKa = 11.84TATKK266 pKa = 10.22SYY268 pKa = 11.04NVTQAFGRR276 pKa = 11.84RR277 pKa = 11.84GPEE280 pKa = 3.4QTQGNFGDD288 pKa = 3.74QDD290 pKa = 5.15LIRR293 pKa = 11.84QGTDD297 pKa = 2.9YY298 pKa = 11.01KK299 pKa = 10.7YY300 pKa = 9.82WPQIAQFAPSASAFFGMSRR319 pKa = 11.84IGMEE323 pKa = 4.09VTPLGTWLTYY333 pKa = 10.49HH334 pKa = 7.02GAIKK338 pKa = 10.61LDD340 pKa = 4.18DD341 pKa = 4.89KK342 pKa = 11.64DD343 pKa = 3.91PQFKK347 pKa = 11.14DD348 pKa = 3.7NVILLNKK355 pKa = 10.08HH356 pKa = 4.75IDD358 pKa = 3.32AYY360 pKa = 10.23KK361 pKa = 10.51AFPPTEE367 pKa = 3.95PKK369 pKa = 9.91KK370 pKa = 10.6DD371 pKa = 3.48KK372 pKa = 10.73KK373 pKa = 10.99KK374 pKa = 9.88KK375 pKa = 8.29TDD377 pKa = 3.29EE378 pKa = 4.34AQPLPQRR385 pKa = 11.84KK386 pKa = 8.41KK387 pKa = 10.06QPTVTLLPAADD398 pKa = 3.84MDD400 pKa = 4.26DD401 pKa = 5.3FSRR404 pKa = 11.84QLQNSMSGASADD416 pKa = 3.63STQAA420 pKa = 3.04
MM1 pKa = 7.77SDD3 pKa = 4.56NGPQNQRR10 pKa = 11.84SAPRR14 pKa = 11.84ITFGGPSDD22 pKa = 3.8STDD25 pKa = 3.04NNQDD29 pKa = 3.07GGRR32 pKa = 11.84SGARR36 pKa = 11.84PKK38 pKa = 10.25QRR40 pKa = 11.84RR41 pKa = 11.84PQGLPNNTASWFTALTQHH59 pKa = 6.06GKK61 pKa = 10.36EE62 pKa = 3.96EE63 pKa = 4.07LRR65 pKa = 11.84FPRR68 pKa = 11.84GQGVPINTNSGKK80 pKa = 10.01DD81 pKa = 3.58DD82 pKa = 3.56QIGYY86 pKa = 8.17YY87 pKa = 9.92RR88 pKa = 11.84RR89 pKa = 11.84ATRR92 pKa = 11.84RR93 pKa = 11.84VRR95 pKa = 11.84GGDD98 pKa = 3.05GKK100 pKa = 10.01MKK102 pKa = 10.32KK103 pKa = 10.19LSPRR107 pKa = 11.84WYY109 pKa = 9.82FYY111 pKa = 11.5YY112 pKa = 10.73LGTGPEE118 pKa = 3.63ASLPYY123 pKa = 9.9GANKK127 pKa = 9.97EE128 pKa = 4.24GIVWVATEE136 pKa = 4.37GALNTPKK143 pKa = 10.91DD144 pKa = 4.0HH145 pKa = 7.46IGTRR149 pKa = 11.84NPNNNAAIVLQLPQGTTLPKK169 pKa = 10.34GFYY172 pKa = 10.67AEE174 pKa = 4.5GSRR177 pKa = 11.84GGSQASSRR185 pKa = 11.84SSSRR189 pKa = 11.84SRR191 pKa = 11.84GNSRR195 pKa = 11.84NSTPGSSRR203 pKa = 11.84GNSPARR209 pKa = 11.84MASGSGEE216 pKa = 3.99TALALLLLDD225 pKa = 4.89RR226 pKa = 11.84LNQLEE231 pKa = 4.58SKK233 pKa = 10.86VSGKK237 pKa = 10.04GQQQQGQTVTKK248 pKa = 9.98KK249 pKa = 10.44SAAEE253 pKa = 3.73ASKK256 pKa = 10.76KK257 pKa = 9.61PRR259 pKa = 11.84QKK261 pKa = 9.55RR262 pKa = 11.84TATKK266 pKa = 10.22SYY268 pKa = 11.04NVTQAFGRR276 pKa = 11.84RR277 pKa = 11.84GPEE280 pKa = 3.4QTQGNFGDD288 pKa = 3.74QDD290 pKa = 5.15LIRR293 pKa = 11.84QGTDD297 pKa = 2.9YY298 pKa = 11.01KK299 pKa = 10.7YY300 pKa = 9.82WPQIAQFAPSASAFFGMSRR319 pKa = 11.84IGMEE323 pKa = 4.09VTPLGTWLTYY333 pKa = 10.49HH334 pKa = 7.02GAIKK338 pKa = 10.61LDD340 pKa = 4.18DD341 pKa = 4.89KK342 pKa = 11.64DD343 pKa = 3.91PQFKK347 pKa = 11.14DD348 pKa = 3.7NVILLNKK355 pKa = 10.08HH356 pKa = 4.75IDD358 pKa = 3.32AYY360 pKa = 10.23KK361 pKa = 10.51AFPPTEE367 pKa = 3.95PKK369 pKa = 9.91KK370 pKa = 10.6DD371 pKa = 3.48KK372 pKa = 10.73KK373 pKa = 10.99KK374 pKa = 9.88KK375 pKa = 8.29TDD377 pKa = 3.29EE378 pKa = 4.34AQPLPQRR385 pKa = 11.84KK386 pKa = 8.41KK387 pKa = 10.06QPTVTLLPAADD398 pKa = 3.84MDD400 pKa = 4.26DD401 pKa = 5.3FSRR404 pKa = 11.84QLQNSMSGASADD416 pKa = 3.63STQAA420 pKa = 3.04
Molecular weight: 45.82 kDa
Isoelectric point according different methods:
Peptides (in silico digests for buttom-up proteomics)
Below you can find in silico digests of the whole proteome with Trypsin, Chymotrypsin, Trypsin+LysC, LysN, ArgC proteases suitable for different mass spec machines.| Try ESI |
 |
|---|
| ChTry ESI |
|
|---|
| ArgC ESI |
|
|---|
| LysN ESI |
|
|---|
| TryLysC ESI |
|
|---|
| Try MALDI |
|
|---|
| ChTry MALDI |
|
|---|
| ArgC MALDI |
|
|---|
| LysN MALDI |
|
|---|
| TryLysC MALDI |
|
|---|
| Try LTQ |
|
|---|
| ChTry LTQ |
|
|---|
| ArgC LTQ |
|
|---|
| LysN LTQ |
|
|---|
| TryLysC LTQ |
|
|---|
| Try MSlow |
|
|---|
| ChTry MSlow |
|
|---|
| ArgC MSlow |
|
|---|
| LysN MSlow |
|
|---|
| TryLysC MSlow |
|
|---|
| Try MShigh |
|
|---|
| ChTry MShigh |
|
|---|
| ArgC MShigh |
|
|---|
| LysN MShigh |
|
|---|
| TryLysC MShigh |
|
|---|
General Statistics
Number of major isoforms |
Number of additional isoforms |
Number of all proteins |
Number of amino acids |
Min. Seq. Length |
Max. Seq. Length |
Avg. Seq. Length |
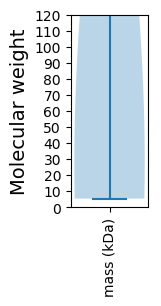
Avg. Mol. Weight |
|---|---|---|---|---|---|---|---|
0 |
14146 |
44 |
7079 |
1178.8 |
131.58 |
Amino acid frequency
Ala |
Cys |
Asp |
Glu |
Phe |
Gly |
His |
Ile |
Lys |
Leu |
|---|---|---|---|---|---|---|---|---|---|
7.267 ± 0.245 | 3.139 ± 0.445 |
5.182 ± 0.262 | 5.054 ± 0.415 |
4.779 ± 0.285 | 6.016 ± 0.374 |
1.951 ± 0.242 | 5.019 ± 0.53 |
5.691 ± 0.289 | 9.847 ± 0.518 |
Met |
Asn |
Gln |
Pro |
Arg |
Ser |
Thr |
Val |
Trp |
Tyr |
|---|---|---|---|---|---|---|---|---|---|
2.404 ± 0.227 | 4.991 ± 0.245 |
3.923 ± 0.49 | 3.662 ± 0.587 |
3.733 ± 0.501 | 6.659 ± 0.467 |
7.034 ± 0.227 | 8.059 ± 0.699 |
1.082 ± 0.107 | 4.51 ± 0.239 |
Most of the basic statistics you can see at this page can be downloaded from this CSV file
See this proteome in:

Proteome-pI is available under Creative Commons Attribution-NoDerivs license, for more details see here
| Reference: Kozlowski LP. Proteome-pI 2.0: Proteome Isoelectric Point Database Update. Nucleic Acids Res. 2021, doi: 10.1093/nar/gkab944 | Contact: Lukasz P. Kozlowski |