Mycobacterium phage SassyB
Taxonomy: Viruses; Duplodnaviria; Heunggongvirae; Uroviricota; Caudoviricetes; Caudovirales; Siphoviridae; Cheoctovirus; unclassified Cheoctovirus
Average proteome isoelectric point is 5.95
Get precalculated fractions of proteins
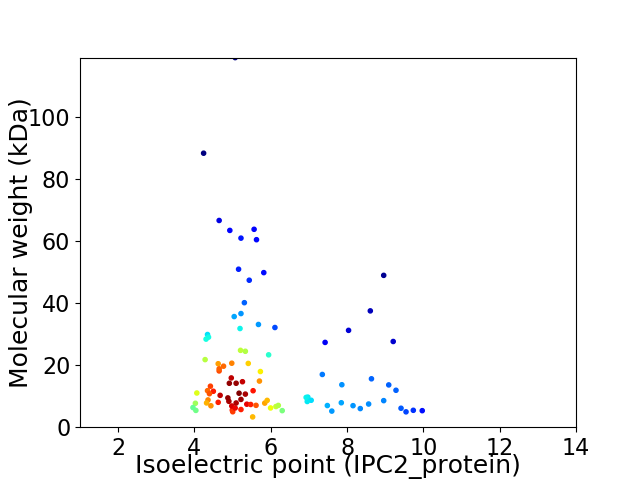
Virtual 2D-PAGE plot for 95 proteins (isoelectric point calculated using IPC2_protein)
Get csv file with sequences according to given criteria:
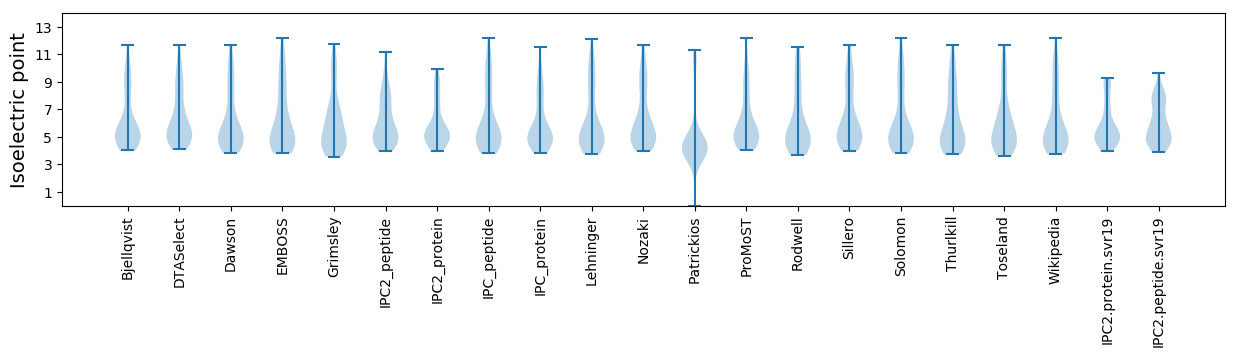
* You can choose from 21 different methods for calculating isoelectric point
Summary statistics related to proteome-wise predictions
Protein with the lowest isoelectric point:
>tr|A0A1U9WRV0|A0A1U9WRV0_9CAUD Uncharacterized protein OS=Mycobacterium phage SassyB OX=1958910 GN=72 PE=4 SV=1
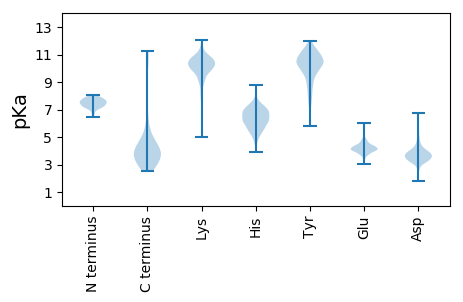
MM1 pKa = 7.59SGDD4 pKa = 3.12INAEE8 pKa = 3.61GFIRR12 pKa = 11.84YY13 pKa = 9.51GGDD16 pKa = 3.52CTCGAIYY23 pKa = 9.12TYY25 pKa = 10.64GGHH28 pKa = 7.08AEE30 pKa = 4.57PGSFDD35 pKa = 4.3PFCPDD40 pKa = 2.7HH41 pKa = 7.27GEE43 pKa = 4.02AAVVATGEE51 pKa = 4.19EE52 pKa = 4.15AA53 pKa = 3.78
MM1 pKa = 7.59SGDD4 pKa = 3.12INAEE8 pKa = 3.61GFIRR12 pKa = 11.84YY13 pKa = 9.51GGDD16 pKa = 3.52CTCGAIYY23 pKa = 9.12TYY25 pKa = 10.64GGHH28 pKa = 7.08AEE30 pKa = 4.57PGSFDD35 pKa = 4.3PFCPDD40 pKa = 2.7HH41 pKa = 7.27GEE43 pKa = 4.02AAVVATGEE51 pKa = 4.19EE52 pKa = 4.15AA53 pKa = 3.78
Molecular weight: 5.41 kDa
Isoelectric point according different methods:
Protein with the highest isoelectric point:
>tr|A0A1U9WRV1|A0A1U9WRV1_9CAUD Uncharacterized protein OS=Mycobacterium phage SassyB OX=1958910 GN=66 PE=4 SV=1
MM1 pKa = 7.83LSRR4 pKa = 11.84HH5 pKa = 4.81VKK7 pKa = 10.09ALRR10 pKa = 11.84TAVKK14 pKa = 9.18FYY16 pKa = 11.08RR17 pKa = 11.84MSLVAQRR24 pKa = 11.84RR25 pKa = 11.84RR26 pKa = 11.84EE27 pKa = 3.75EE28 pKa = 3.46WRR30 pKa = 11.84AKK32 pKa = 10.16HH33 pKa = 6.56GEE35 pKa = 4.07ASWITTTGEE44 pKa = 3.79EE45 pKa = 4.09AA46 pKa = 3.64
MM1 pKa = 7.83LSRR4 pKa = 11.84HH5 pKa = 4.81VKK7 pKa = 10.09ALRR10 pKa = 11.84TAVKK14 pKa = 9.18FYY16 pKa = 11.08RR17 pKa = 11.84MSLVAQRR24 pKa = 11.84RR25 pKa = 11.84RR26 pKa = 11.84EE27 pKa = 3.75EE28 pKa = 3.46WRR30 pKa = 11.84AKK32 pKa = 10.16HH33 pKa = 6.56GEE35 pKa = 4.07ASWITTTGEE44 pKa = 3.79EE45 pKa = 4.09AA46 pKa = 3.64
Molecular weight: 5.45 kDa
Isoelectric point according different methods:
Peptides (in silico digests for buttom-up proteomics)
Below you can find in silico digests of the whole proteome with Trypsin, Chymotrypsin, Trypsin+LysC, LysN, ArgC proteases suitable for different mass spec machines.| Try ESI |
 |
|---|
| ChTry ESI |
|
|---|
| ArgC ESI |
|
|---|
| LysN ESI |
|
|---|
| TryLysC ESI |
|
|---|
| Try MALDI |
|
|---|
| ChTry MALDI |
|
|---|
| ArgC MALDI |
|
|---|
| LysN MALDI |
|
|---|
| TryLysC MALDI |
|
|---|
| Try LTQ |
|
|---|
| ChTry LTQ |
|
|---|
| ArgC LTQ |
|
|---|
| LysN LTQ |
|
|---|
| TryLysC LTQ |
|
|---|
| Try MSlow |
|
|---|
| ChTry MSlow |
|
|---|
| ArgC MSlow |
|
|---|
| LysN MSlow |
|
|---|
| TryLysC MSlow |
|
|---|
| Try MShigh |
|
|---|
| ChTry MShigh |
|
|---|
| ArgC MShigh |
|
|---|
| LysN MShigh |
|
|---|
| TryLysC MShigh |
|
|---|
General Statistics
Number of major isoforms |
Number of additional isoforms |
Number of all proteins |
Number of amino acids |
Min. Seq. Length |
Max. Seq. Length |
Avg. Seq. Length |
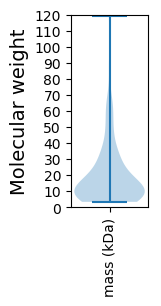
Avg. Mol. Weight |
|---|---|---|---|---|---|---|---|
0 |
17477 |
30 |
1176 |
184.0 |
20.08 |
Amino acid frequency
Ala |
Cys |
Asp |
Glu |
Phe |
Gly |
His |
Ile |
Lys |
Leu |
|---|---|---|---|---|---|---|---|---|---|
10.705 ± 0.447 | 1.127 ± 0.149 |
6.614 ± 0.227 | 5.819 ± 0.307 |
2.958 ± 0.205 | 8.84 ± 0.523 |
2.232 ± 0.203 | 4.349 ± 0.19 |
3.29 ± 0.195 | 7.25 ± 0.218 |
Met |
Asn |
Gln |
Pro |
Arg |
Ser |
Thr |
Val |
Trp |
Tyr |
|---|---|---|---|---|---|---|---|---|---|
2.214 ± 0.14 | 3.33 ± 0.171 |
6.294 ± 0.222 | 3.485 ± 0.204 |
6.752 ± 0.383 | 5.836 ± 0.26 |
6.969 ± 0.266 | 7.209 ± 0.305 |
2.312 ± 0.142 | 2.415 ± 0.153 |
Most of the basic statistics you can see at this page can be downloaded from this CSV file
See this proteome in:

Proteome-pI is available under Creative Commons Attribution-NoDerivs license, for more details see here
| Reference: Kozlowski LP. Proteome-pI 2.0: Proteome Isoelectric Point Database Update. Nucleic Acids Res. 2021, doi: 10.1093/nar/gkab944 | Contact: Lukasz P. Kozlowski |