Blautia sp. YL58
Taxonomy: cellular organisms; Bacteria; Terrabacteria group; Firmicutes; Clostridia; Eubacteriales; Lachnospiraceae; Blautia
Average proteome isoelectric point is 6.22
Get precalculated fractions of proteins
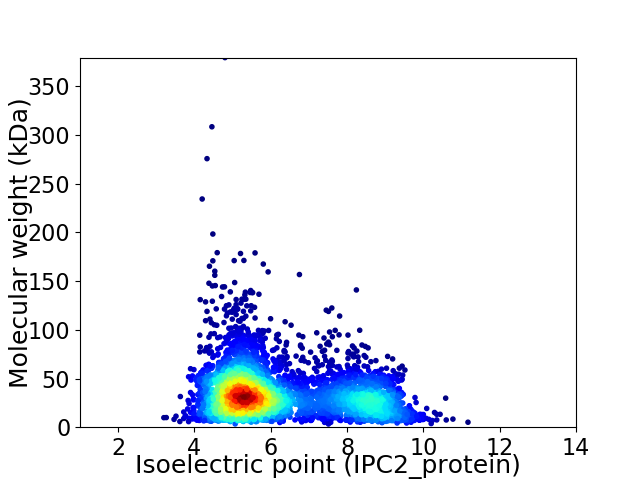
Virtual 2D-PAGE plot for 4518 proteins (isoelectric point calculated using IPC2_protein)
Get csv file with sequences according to given criteria:
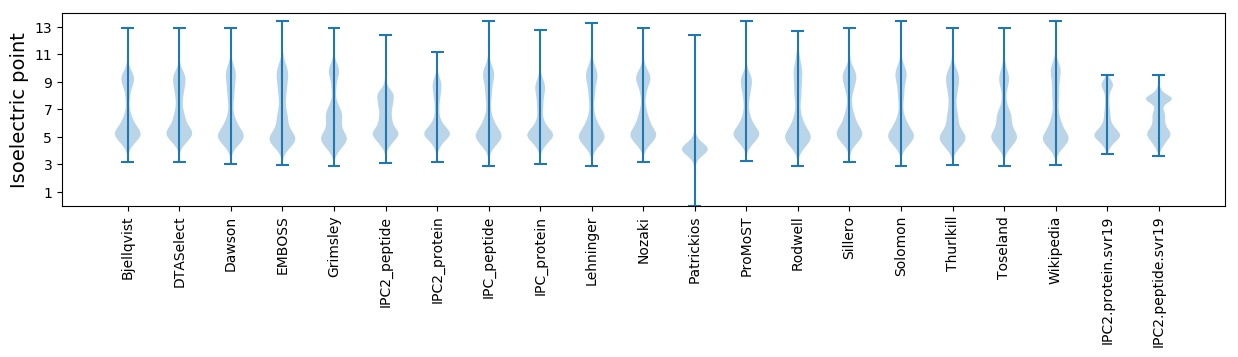
* You can choose from 21 different methods for calculating isoelectric point
Summary statistics related to proteome-wise predictions
Protein with the lowest isoelectric point:
>tr|A0A1C7I788|A0A1C7I788_9FIRM Uroporphyrinogen_deCOase domain-containing protein OS=Blautia sp. YL58 OX=1796616 GN=A4V09_03225 PE=4 SV=1
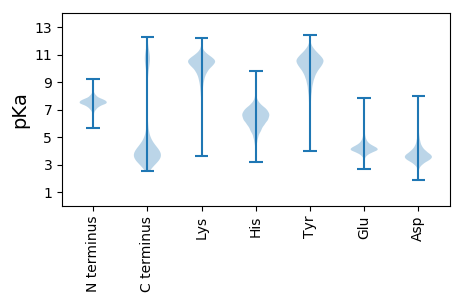
MM1 pKa = 7.52RR2 pKa = 11.84AEE4 pKa = 3.83TGIRR8 pKa = 11.84ADD10 pKa = 4.57CNTSTNVIDD19 pKa = 5.49LLMANKK25 pKa = 10.16SPVEE29 pKa = 3.56ICGIINKK36 pKa = 9.36LLNCLLFDD44 pKa = 5.17GIEE47 pKa = 4.19VQDD50 pKa = 4.1GDD52 pKa = 4.36NPGDD56 pKa = 3.64GCLDD60 pKa = 4.08YY61 pKa = 10.28ITYY64 pKa = 10.81NPDD67 pKa = 3.6DD68 pKa = 3.8DD69 pKa = 4.07TLYY72 pKa = 11.0FFTKK76 pKa = 10.56DD77 pKa = 2.99LGRR80 pKa = 5.45
MM1 pKa = 7.52RR2 pKa = 11.84AEE4 pKa = 3.83TGIRR8 pKa = 11.84ADD10 pKa = 4.57CNTSTNVIDD19 pKa = 5.49LLMANKK25 pKa = 10.16SPVEE29 pKa = 3.56ICGIINKK36 pKa = 9.36LLNCLLFDD44 pKa = 5.17GIEE47 pKa = 4.19VQDD50 pKa = 4.1GDD52 pKa = 4.36NPGDD56 pKa = 3.64GCLDD60 pKa = 4.08YY61 pKa = 10.28ITYY64 pKa = 10.81NPDD67 pKa = 3.6DD68 pKa = 3.8DD69 pKa = 4.07TLYY72 pKa = 11.0FFTKK76 pKa = 10.56DD77 pKa = 2.99LGRR80 pKa = 5.45
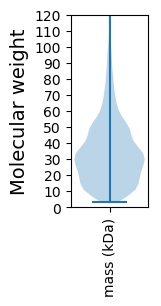
Molecular weight: 8.85 kDa
Isoelectric point according different methods:
Protein with the highest isoelectric point:
>tr|A0A1C7IDT7|A0A1C7IDT7_9FIRM Stage 0 sporulation protein A homolog OS=Blautia sp. YL58 OX=1796616 GN=A4V09_19985 PE=4 SV=2
MM1 pKa = 7.67KK2 pKa = 8.72MTFQPKK8 pKa = 9.06KK9 pKa = 8.03RR10 pKa = 11.84SRR12 pKa = 11.84SKK14 pKa = 9.44VHH16 pKa = 6.17GFRR19 pKa = 11.84ARR21 pKa = 11.84MSTKK25 pKa = 10.26AGRR28 pKa = 11.84KK29 pKa = 8.22VLAARR34 pKa = 11.84RR35 pKa = 11.84LKK37 pKa = 10.38GRR39 pKa = 11.84KK40 pKa = 8.94RR41 pKa = 11.84LSAA44 pKa = 3.96
MM1 pKa = 7.67KK2 pKa = 8.72MTFQPKK8 pKa = 9.06KK9 pKa = 8.03RR10 pKa = 11.84SRR12 pKa = 11.84SKK14 pKa = 9.44VHH16 pKa = 6.17GFRR19 pKa = 11.84ARR21 pKa = 11.84MSTKK25 pKa = 10.26AGRR28 pKa = 11.84KK29 pKa = 8.22VLAARR34 pKa = 11.84RR35 pKa = 11.84LKK37 pKa = 10.38GRR39 pKa = 11.84KK40 pKa = 8.94RR41 pKa = 11.84LSAA44 pKa = 3.96
Molecular weight: 5.11 kDa
Isoelectric point according different methods:
Peptides (in silico digests for buttom-up proteomics)
Below you can find in silico digests of the whole proteome with Trypsin, Chymotrypsin, Trypsin+LysC, LysN, ArgC proteases suitable for different mass spec machines.| Try ESI |
 |
|---|
| ChTry ESI |
|
|---|
| ArgC ESI |
|
|---|
| LysN ESI |
|
|---|
| TryLysC ESI |
|
|---|
| Try MALDI |
|
|---|
| ChTry MALDI |
|
|---|
| ArgC MALDI |
|
|---|
| LysN MALDI |
|
|---|
| TryLysC MALDI |
|
|---|
| Try LTQ |
|
|---|
| ChTry LTQ |
|
|---|
| ArgC LTQ |
|
|---|
| LysN LTQ |
|
|---|
| TryLysC LTQ |
|
|---|
| Try MSlow |
|
|---|
| ChTry MSlow |
|
|---|
| ArgC MSlow |
|
|---|
| LysN MSlow |
|
|---|
| TryLysC MSlow |
|
|---|
| Try MShigh |
|
|---|
| ChTry MShigh |
|
|---|
| ArgC MShigh |
|
|---|
| LysN MShigh |
|
|---|
| TryLysC MShigh |
|
|---|
General Statistics
Number of major isoforms |
Number of additional isoforms |
Number of all proteins |
Number of amino acids |
Min. Seq. Length |
Max. Seq. Length |
Avg. Seq. Length |
Avg. Mol. Weight |
|---|---|---|---|---|---|---|---|
0 |
1457493 |
29 |
3477 |
322.6 |
36.25 |
Amino acid frequency
Ala |
Cys |
Asp |
Glu |
Phe |
Gly |
His |
Ile |
Lys |
Leu |
|---|---|---|---|---|---|---|---|---|---|
7.367 ± 0.04 | 1.625 ± 0.016 |
5.44 ± 0.034 | 7.615 ± 0.045 |
4.253 ± 0.029 | 7.337 ± 0.033 |
1.802 ± 0.017 | 7.09 ± 0.038 |
6.697 ± 0.028 | 9.104 ± 0.048 |
Met |
Asn |
Gln |
Pro |
Arg |
Ser |
Thr |
Val |
Trp |
Tyr |
|---|---|---|---|---|---|---|---|---|---|
3.261 ± 0.02 | 4.104 ± 0.03 |
3.432 ± 0.02 | 3.272 ± 0.021 |
4.601 ± 0.03 | 5.743 ± 0.025 |
5.224 ± 0.024 | 6.813 ± 0.034 |
1.043 ± 0.017 | 4.178 ± 0.029 |
Most of the basic statistics you can see at this page can be downloaded from this CSV file
See this proteome in:

Proteome-pI is available under Creative Commons Attribution-NoDerivs license, for more details see here
| Reference: Kozlowski LP. Proteome-pI 2.0: Proteome Isoelectric Point Database Update. Nucleic Acids Res. 2021, doi: 10.1093/nar/gkab944 | Contact: Lukasz P. Kozlowski |