Aeromonas phage D6
Taxonomy: Viruses; Duplodnaviria; Heunggongvirae; Uroviricota; Caudoviricetes; Caudovirales; Myoviridae; unclassified Myoviridae
Average proteome isoelectric point is 6.17
Get precalculated fractions of proteins
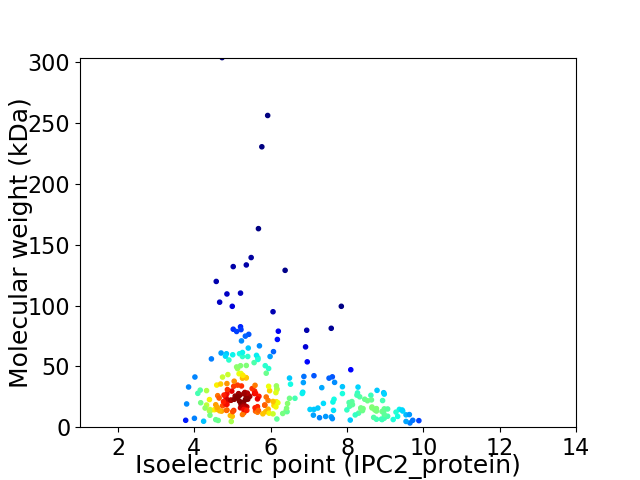
Virtual 2D-PAGE plot for 262 proteins (isoelectric point calculated using IPC2_protein)
Get csv file with sequences according to given criteria:
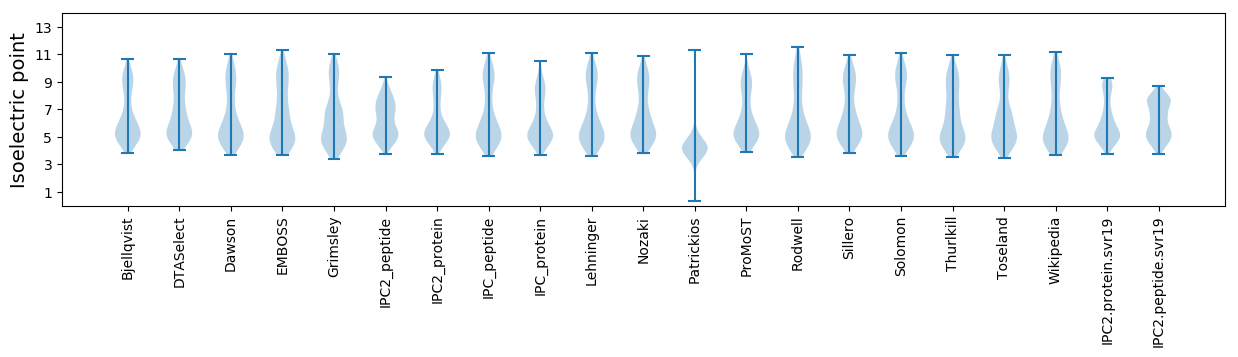
* You can choose from 21 different methods for calculating isoelectric point
Summary statistics related to proteome-wise predictions
Protein with the lowest isoelectric point:
>tr|A0A514TVZ8|A0A514TVZ8_9CAUD Uncharacterized protein OS=Aeromonas phage D6 OX=2593322 GN=D6_0038 PE=4 SV=1
MM1 pKa = 7.61CGSDD5 pKa = 3.66TPFVLQDD12 pKa = 3.84TIVHH16 pKa = 6.83LDD18 pKa = 3.65LLIDD22 pKa = 3.74EE23 pKa = 4.81VDD25 pKa = 3.5RR26 pKa = 11.84SKK28 pKa = 11.67DD29 pKa = 3.13LANFYY34 pKa = 11.14FEE36 pKa = 4.86GNIFIIVEE44 pKa = 4.12DD45 pKa = 4.26PYY47 pKa = 11.4GTVV50 pKa = 2.95
MM1 pKa = 7.61CGSDD5 pKa = 3.66TPFVLQDD12 pKa = 3.84TIVHH16 pKa = 6.83LDD18 pKa = 3.65LLIDD22 pKa = 3.74EE23 pKa = 4.81VDD25 pKa = 3.5RR26 pKa = 11.84SKK28 pKa = 11.67DD29 pKa = 3.13LANFYY34 pKa = 11.14FEE36 pKa = 4.86GNIFIIVEE44 pKa = 4.12DD45 pKa = 4.26PYY47 pKa = 11.4GTVV50 pKa = 2.95
Molecular weight: 5.68 kDa
Isoelectric point according different methods:
Protein with the highest isoelectric point:
>tr|A0A514TWL3|A0A514TWL3_9CAUD Uncharacterized protein OS=Aeromonas phage D6 OX=2593322 GN=D6_0257 PE=4 SV=1
MM1 pKa = 7.74TDD3 pKa = 3.83DD4 pKa = 3.99NLPRR8 pKa = 11.84YY9 pKa = 9.56IPLDD13 pKa = 3.74YY14 pKa = 10.25IGKK17 pKa = 8.89IRR19 pKa = 11.84SRR21 pKa = 11.84VKK23 pKa = 10.14KK24 pKa = 9.99HH25 pKa = 5.83DD26 pKa = 3.67AARR29 pKa = 11.84LKK31 pKa = 11.12AMYY34 pKa = 9.56EE35 pKa = 3.8RR36 pKa = 11.84ARR38 pKa = 11.84NVVKK42 pKa = 11.03NNTQSKK48 pKa = 9.89
MM1 pKa = 7.74TDD3 pKa = 3.83DD4 pKa = 3.99NLPRR8 pKa = 11.84YY9 pKa = 9.56IPLDD13 pKa = 3.74YY14 pKa = 10.25IGKK17 pKa = 8.89IRR19 pKa = 11.84SRR21 pKa = 11.84VKK23 pKa = 10.14KK24 pKa = 9.99HH25 pKa = 5.83DD26 pKa = 3.67AARR29 pKa = 11.84LKK31 pKa = 11.12AMYY34 pKa = 9.56EE35 pKa = 3.8RR36 pKa = 11.84ARR38 pKa = 11.84NVVKK42 pKa = 11.03NNTQSKK48 pKa = 9.89
Molecular weight: 5.68 kDa
Isoelectric point according different methods:
Peptides (in silico digests for buttom-up proteomics)
Below you can find in silico digests of the whole proteome with Trypsin, Chymotrypsin, Trypsin+LysC, LysN, ArgC proteases suitable for different mass spec machines.| Try ESI |
 |
|---|
| ChTry ESI |
|
|---|
| ArgC ESI |
|
|---|
| LysN ESI |
|
|---|
| TryLysC ESI |
|
|---|
| Try MALDI |
|
|---|
| ChTry MALDI |
|
|---|
| ArgC MALDI |
|
|---|
| LysN MALDI |
|
|---|
| TryLysC MALDI |
|
|---|
| Try LTQ |
|
|---|
| ChTry LTQ |
|
|---|
| ArgC LTQ |
|
|---|
| LysN LTQ |
|
|---|
| TryLysC LTQ |
|
|---|
| Try MSlow |
|
|---|
| ChTry MSlow |
|
|---|
| ArgC MSlow |
|
|---|
| LysN MSlow |
|
|---|
| TryLysC MSlow |
|
|---|
| Try MShigh |
|
|---|
| ChTry MShigh |
|
|---|
| ArgC MShigh |
|
|---|
| LysN MShigh |
|
|---|
| TryLysC MShigh |
|
|---|
General Statistics
Number of major isoforms |
Number of additional isoforms |
Number of all proteins |
Number of amino acids |
Min. Seq. Length |
Max. Seq. Length |
Avg. Seq. Length |
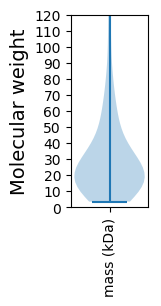
Avg. Mol. Weight |
|---|---|---|---|---|---|---|---|
0 |
79372 |
30 |
2794 |
302.9 |
34.16 |
Amino acid frequency
Ala |
Cys |
Asp |
Glu |
Phe |
Gly |
His |
Ile |
Lys |
Leu |
|---|---|---|---|---|---|---|---|---|---|
6.487 ± 0.185 | 0.944 ± 0.053 |
6.384 ± 0.091 | 6.738 ± 0.137 |
4.566 ± 0.135 | 6.829 ± 0.137 |
2.021 ± 0.077 | 6.26 ± 0.116 |
6.249 ± 0.114 | 8.281 ± 0.141 |
Met |
Asn |
Gln |
Pro |
Arg |
Ser |
Thr |
Val |
Trp |
Tyr |
|---|---|---|---|---|---|---|---|---|---|
3.182 ± 0.093 | 5.381 ± 0.128 |
4.018 ± 0.113 | 3.281 ± 0.101 |
4.873 ± 0.123 | 6.037 ± 0.1 |
6.283 ± 0.19 | 7.15 ± 0.144 |
1.179 ± 0.063 | 3.857 ± 0.117 |
Most of the basic statistics you can see at this page can be downloaded from this CSV file
See this proteome in:

Proteome-pI is available under Creative Commons Attribution-NoDerivs license, for more details see here
| Reference: Kozlowski LP. Proteome-pI 2.0: Proteome Isoelectric Point Database Update. Nucleic Acids Res. 2021, doi: 10.1093/nar/gkab944 | Contact: Lukasz P. Kozlowski |