Mycobacterium phage Misha28
Taxonomy: Viruses; Duplodnaviria; Heunggongvirae; Uroviricota; Caudoviricetes; Caudovirales; Siphoviridae; Cheoctovirus; unclassified Cheoctovirus
Average proteome isoelectric point is 5.97
Get precalculated fractions of proteins
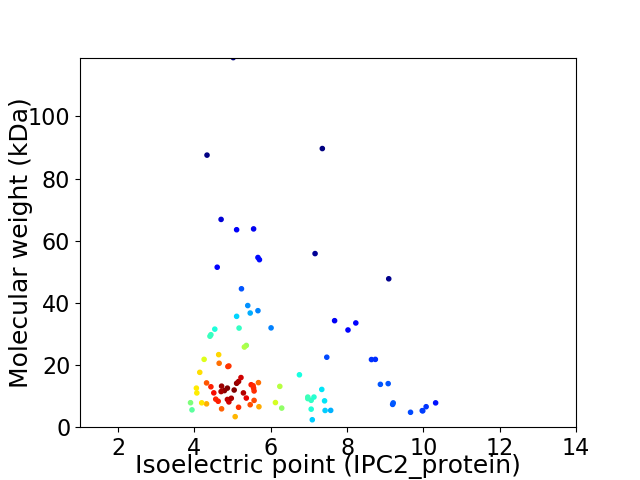
Virtual 2D-PAGE plot for 93 proteins (isoelectric point calculated using IPC2_protein)
Get csv file with sequences according to given criteria:
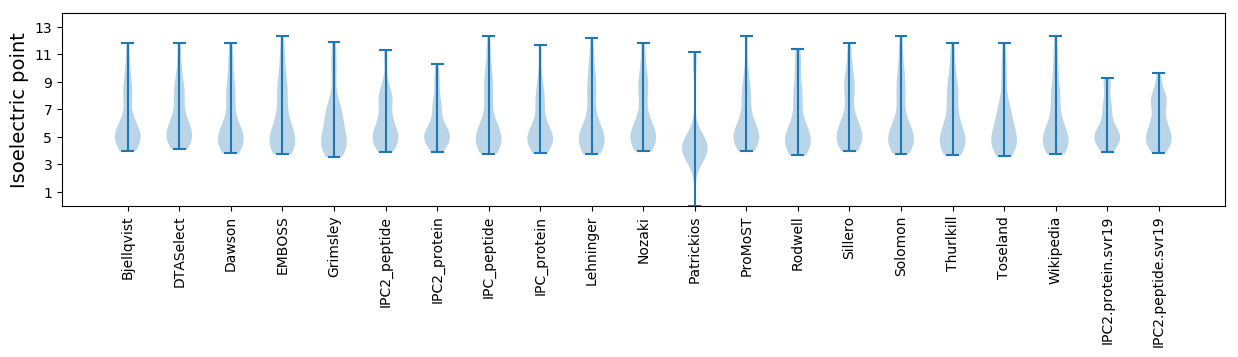
* You can choose from 21 different methods for calculating isoelectric point
Summary statistics related to proteome-wise predictions
Protein with the lowest isoelectric point:
>tr|A0A2P1N2Z0|A0A2P1N2Z0_9CAUD Uncharacterized protein OS=Mycobacterium phage Misha28 OX=2126810 GN=79 PE=4 SV=1
MM1 pKa = 7.24TALNYY6 pKa = 10.86DD7 pKa = 3.81EE8 pKa = 5.43TPCALCDD15 pKa = 4.32CYY17 pKa = 11.21GLQHH21 pKa = 7.56DD22 pKa = 4.88DD23 pKa = 4.18PEE25 pKa = 6.27HH26 pKa = 6.52GGPCRR31 pKa = 11.84ALDD34 pKa = 3.85GHH36 pKa = 6.57GLPCGCPGFEE46 pKa = 4.15EE47 pKa = 5.43PEE49 pKa = 4.41DD50 pKa = 3.77EE51 pKa = 4.43TT52 pKa = 5.06
MM1 pKa = 7.24TALNYY6 pKa = 10.86DD7 pKa = 3.81EE8 pKa = 5.43TPCALCDD15 pKa = 4.32CYY17 pKa = 11.21GLQHH21 pKa = 7.56DD22 pKa = 4.88DD23 pKa = 4.18PEE25 pKa = 6.27HH26 pKa = 6.52GGPCRR31 pKa = 11.84ALDD34 pKa = 3.85GHH36 pKa = 6.57GLPCGCPGFEE46 pKa = 4.15EE47 pKa = 5.43PEE49 pKa = 4.41DD50 pKa = 3.77EE51 pKa = 4.43TT52 pKa = 5.06
Molecular weight: 5.58 kDa
Isoelectric point according different methods:
Protein with the highest isoelectric point:
>tr|A0A2P1N2V6|A0A2P1N2V6_9CAUD Uncharacterized protein OS=Mycobacterium phage Misha28 OX=2126810 GN=24 PE=4 SV=1
MM1 pKa = 7.4LTRR4 pKa = 11.84SFWIDD9 pKa = 2.95AVEE12 pKa = 3.85RR13 pKa = 11.84AARR16 pKa = 11.84TFAQTAIAALGAGAVDD32 pKa = 4.35LLKK35 pKa = 10.09TDD37 pKa = 3.38WVSVLSVSGGAAVVSLLMSIAAEE60 pKa = 3.82RR61 pKa = 11.84RR62 pKa = 11.84GNPGTASATRR72 pKa = 11.84AVTAAA77 pKa = 3.71
MM1 pKa = 7.4LTRR4 pKa = 11.84SFWIDD9 pKa = 2.95AVEE12 pKa = 3.85RR13 pKa = 11.84AARR16 pKa = 11.84TFAQTAIAALGAGAVDD32 pKa = 4.35LLKK35 pKa = 10.09TDD37 pKa = 3.38WVSVLSVSGGAAVVSLLMSIAAEE60 pKa = 3.82RR61 pKa = 11.84RR62 pKa = 11.84GNPGTASATRR72 pKa = 11.84AVTAAA77 pKa = 3.71
Molecular weight: 7.82 kDa
Isoelectric point according different methods:
Peptides (in silico digests for buttom-up proteomics)
Below you can find in silico digests of the whole proteome with Trypsin, Chymotrypsin, Trypsin+LysC, LysN, ArgC proteases suitable for different mass spec machines.| Try ESI |
 |
|---|
| ChTry ESI |
|
|---|
| ArgC ESI |
|
|---|
| LysN ESI |
|
|---|
| TryLysC ESI |
|
|---|
| Try MALDI |
|
|---|
| ChTry MALDI |
|
|---|
| ArgC MALDI |
|
|---|
| LysN MALDI |
|
|---|
| TryLysC MALDI |
|
|---|
| Try LTQ |
|
|---|
| ChTry LTQ |
|
|---|
| ArgC LTQ |
|
|---|
| LysN LTQ |
|
|---|
| TryLysC LTQ |
|
|---|
| Try MSlow |
|
|---|
| ChTry MSlow |
|
|---|
| ArgC MSlow |
|
|---|
| LysN MSlow |
|
|---|
| TryLysC MSlow |
|
|---|
| Try MShigh |
|
|---|
| ChTry MShigh |
|
|---|
| ArgC MShigh |
|
|---|
| LysN MShigh |
|
|---|
| TryLysC MShigh |
|
|---|
General Statistics
Number of major isoforms |
Number of additional isoforms |
Number of all proteins |
Number of amino acids |
Min. Seq. Length |
Max. Seq. Length |
Avg. Seq. Length |
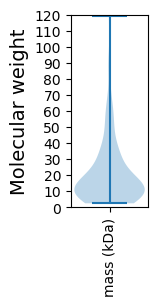
Avg. Mol. Weight |
|---|---|---|---|---|---|---|---|
0 |
18374 |
23 |
1176 |
197.6 |
21.51 |
Amino acid frequency
Ala |
Cys |
Asp |
Glu |
Phe |
Gly |
His |
Ile |
Lys |
Leu |
|---|---|---|---|---|---|---|---|---|---|
11.239 ± 0.472 | 1.11 ± 0.168 |
6.803 ± 0.283 | 5.638 ± 0.247 |
2.89 ± 0.174 | 9.143 ± 0.615 |
2.27 ± 0.203 | 4.316 ± 0.205 |
3.162 ± 0.194 | 7.173 ± 0.229 |
Met |
Asn |
Gln |
Pro |
Arg |
Ser |
Thr |
Val |
Trp |
Tyr |
|---|---|---|---|---|---|---|---|---|---|
2.063 ± 0.112 | 3.129 ± 0.204 |
5.894 ± 0.177 | 3.646 ± 0.214 |
6.988 ± 0.461 | 5.9 ± 0.318 |
6.498 ± 0.222 | 7.336 ± 0.271 |
2.177 ± 0.136 | 2.623 ± 0.136 |
Most of the basic statistics you can see at this page can be downloaded from this CSV file
See this proteome in:

Proteome-pI is available under Creative Commons Attribution-NoDerivs license, for more details see here
| Reference: Kozlowski LP. Proteome-pI 2.0: Proteome Isoelectric Point Database Update. Nucleic Acids Res. 2021, doi: 10.1093/nar/gkab944 | Contact: Lukasz P. Kozlowski |