Methylobacterium sp.
Taxonomy: cellular organisms; Bacteria; Proteobacteria; Alphaproteobacteria; Hyphomicrobiales; Methylobacteriaceae; Methylobacterium; unclassified Methylobacterium
Average proteome isoelectric point is 6.76
Get precalculated fractions of proteins
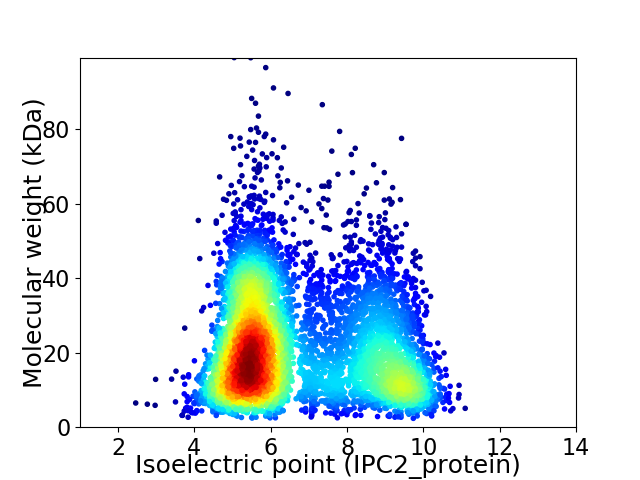
Virtual 2D-PAGE plot for 6219 proteins (isoelectric point calculated using IPC2_protein)
Get csv file with sequences according to given criteria:
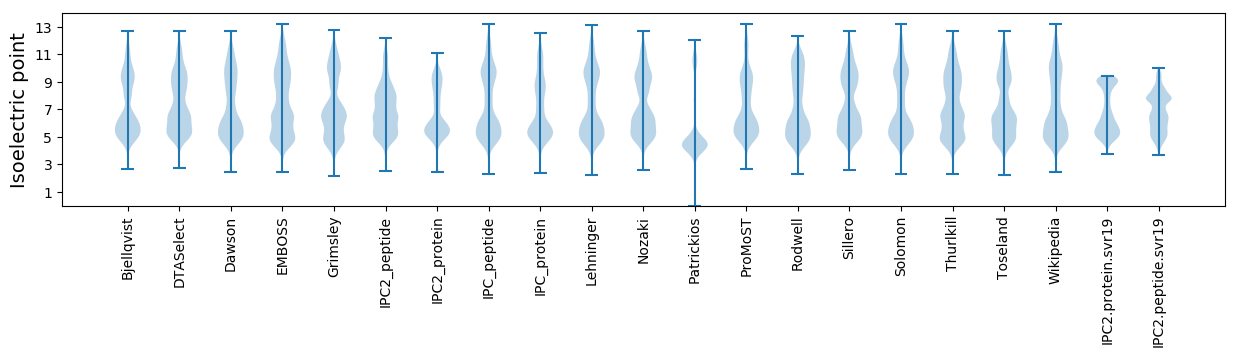
* You can choose from 21 different methods for calculating isoelectric point
Summary statistics related to proteome-wise predictions
Protein with the lowest isoelectric point:
>tr|A0A519YE89|A0A519YE89_9RHIZ Malonate transporter subunit MadM OS=Methylobacterium sp. OX=409 GN=madM PE=4 SV=1
MM1 pKa = 7.33ITDD4 pKa = 3.97LWYY7 pKa = 10.58KK8 pKa = 10.46NAVIYY13 pKa = 9.86CLSVATFMDD22 pKa = 4.17ADD24 pKa = 3.96GDD26 pKa = 4.54GIGDD30 pKa = 3.78FAGLEE35 pKa = 3.84RR36 pKa = 11.84RR37 pKa = 11.84LDD39 pKa = 3.75YY40 pKa = 11.22LQGLGVTAVWLMPFQPSPP58 pKa = 3.27
MM1 pKa = 7.33ITDD4 pKa = 3.97LWYY7 pKa = 10.58KK8 pKa = 10.46NAVIYY13 pKa = 9.86CLSVATFMDD22 pKa = 4.17ADD24 pKa = 3.96GDD26 pKa = 4.54GIGDD30 pKa = 3.78FAGLEE35 pKa = 3.84RR36 pKa = 11.84RR37 pKa = 11.84LDD39 pKa = 3.75YY40 pKa = 11.22LQGLGVTAVWLMPFQPSPP58 pKa = 3.27
Molecular weight: 6.44 kDa
Isoelectric point according different methods:
Protein with the highest isoelectric point:
>tr|A0A519YNS3|A0A519YNS3_9RHIZ DMT family transporter (Fragment) OS=Methylobacterium sp. OX=409 GN=EOO66_01555 PE=4 SV=1
MM1 pKa = 7.3TKK3 pKa = 9.26TRR5 pKa = 11.84FTASAIAAAAFGAVLMSAGAVSAATPAPAPSLVQPEE41 pKa = 4.39APTVQVRR48 pKa = 11.84MTRR51 pKa = 11.84RR52 pKa = 11.84SMMRR56 pKa = 11.84HH57 pKa = 3.86HH58 pKa = 6.78TMRR61 pKa = 11.84RR62 pKa = 11.84HH63 pKa = 4.08MMRR66 pKa = 11.84RR67 pKa = 11.84GGGRR71 pKa = 11.84TISTKK76 pKa = 10.5LGARR80 pKa = 11.84TRR82 pKa = 3.68
MM1 pKa = 7.3TKK3 pKa = 9.26TRR5 pKa = 11.84FTASAIAAAAFGAVLMSAGAVSAATPAPAPSLVQPEE41 pKa = 4.39APTVQVRR48 pKa = 11.84MTRR51 pKa = 11.84RR52 pKa = 11.84SMMRR56 pKa = 11.84HH57 pKa = 3.86HH58 pKa = 6.78TMRR61 pKa = 11.84RR62 pKa = 11.84HH63 pKa = 4.08MMRR66 pKa = 11.84RR67 pKa = 11.84GGGRR71 pKa = 11.84TISTKK76 pKa = 10.5LGARR80 pKa = 11.84TRR82 pKa = 3.68
Molecular weight: 8.78 kDa
Isoelectric point according different methods:
Peptides (in silico digests for buttom-up proteomics)
Below you can find in silico digests of the whole proteome with Trypsin, Chymotrypsin, Trypsin+LysC, LysN, ArgC proteases suitable for different mass spec machines.| Try ESI |
 |
|---|
| ChTry ESI |
|
|---|
| ArgC ESI |
|
|---|
| LysN ESI |
|
|---|
| TryLysC ESI |
|
|---|
| Try MALDI |
|
|---|
| ChTry MALDI |
|
|---|
| ArgC MALDI |
|
|---|
| LysN MALDI |
|
|---|
| TryLysC MALDI |
|
|---|
| Try LTQ |
|
|---|
| ChTry LTQ |
|
|---|
| ArgC LTQ |
|
|---|
| LysN LTQ |
|
|---|
| TryLysC LTQ |
|
|---|
| Try MSlow |
|
|---|
| ChTry MSlow |
|
|---|
| ArgC MSlow |
|
|---|
| LysN MSlow |
|
|---|
| TryLysC MSlow |
|
|---|
| Try MShigh |
|
|---|
| ChTry MShigh |
|
|---|
| ArgC MShigh |
|
|---|
| LysN MShigh |
|
|---|
| TryLysC MShigh |
|
|---|
General Statistics
Number of major isoforms |
Number of additional isoforms |
Number of all proteins |
Number of amino acids |
Min. Seq. Length |
Max. Seq. Length |
Avg. Seq. Length |
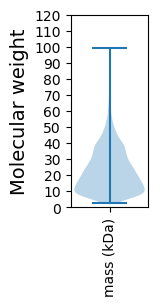
Avg. Mol. Weight |
|---|---|---|---|---|---|---|---|
0 |
1327713 |
20 |
921 |
213.5 |
22.95 |
Amino acid frequency
Ala |
Cys |
Asp |
Glu |
Phe |
Gly |
His |
Ile |
Lys |
Leu |
|---|---|---|---|---|---|---|---|---|---|
13.858 ± 0.046 | 0.833 ± 0.011 |
5.66 ± 0.023 | 5.254 ± 0.033 |
3.439 ± 0.022 | 9.194 ± 0.035 |
2.026 ± 0.014 | 4.539 ± 0.021 |
2.623 ± 0.027 | 10.222 ± 0.038 |
Met |
Asn |
Gln |
Pro |
Arg |
Ser |
Thr |
Val |
Trp |
Tyr |
|---|---|---|---|---|---|---|---|---|---|
2.271 ± 0.014 | 2.17 ± 0.017 |
5.663 ± 0.027 | 2.814 ± 0.018 |
7.805 ± 0.037 | 4.826 ± 0.021 |
5.534 ± 0.022 | 7.775 ± 0.03 |
1.295 ± 0.014 | 2.2 ± 0.018 |
Most of the basic statistics you can see at this page can be downloaded from this CSV file
See this proteome in:

Proteome-pI is available under Creative Commons Attribution-NoDerivs license, for more details see here
| Reference: Kozlowski LP. Proteome-pI 2.0: Proteome Isoelectric Point Database Update. Nucleic Acids Res. 2021, doi: 10.1093/nar/gkab944 | Contact: Lukasz P. Kozlowski |