Mycobacterium phage Jabbawokkie
Taxonomy: Viruses; Duplodnaviria; Heunggongvirae; Uroviricota; Caudoviricetes; Caudovirales; Siphoviridae; Avanivirus; unclassified Avanivirus
Average proteome isoelectric point is 6.13
Get precalculated fractions of proteins
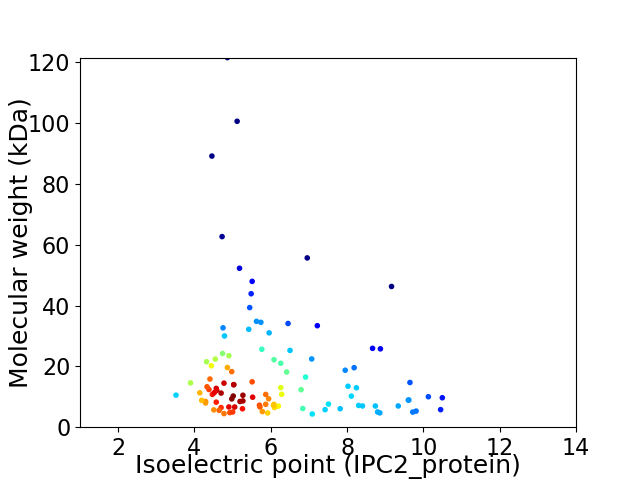
Virtual 2D-PAGE plot for 106 proteins (isoelectric point calculated using IPC2_protein)
Get csv file with sequences according to given criteria:
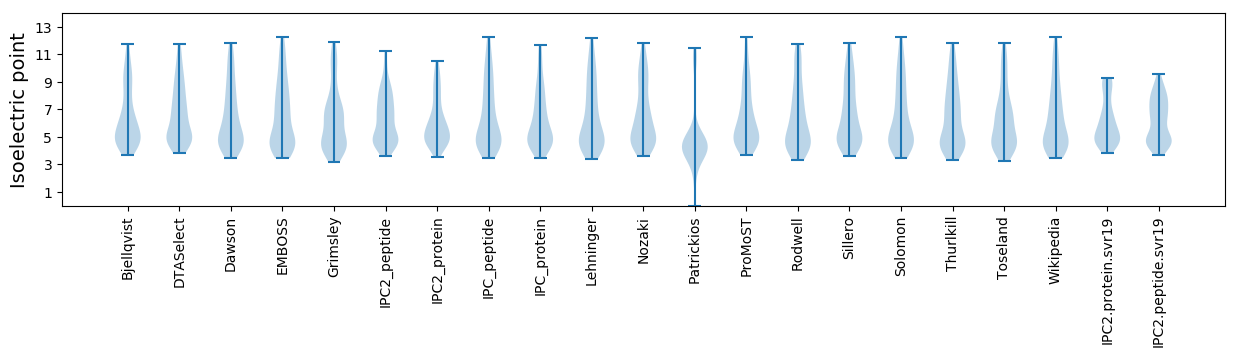
* You can choose from 21 different methods for calculating isoelectric point
Summary statistics related to proteome-wise predictions
Protein with the lowest isoelectric point:
>tr|S5Y3U6|S5Y3U6_9CAUD Uncharacterized protein OS=Mycobacterium phage Jabbawokkie OX=1340820 GN=103 PE=4 SV=1
MM1 pKa = 7.93SDD3 pKa = 3.41PQSTRR8 pKa = 11.84DD9 pKa = 3.4RR10 pKa = 11.84LIANIEE16 pKa = 3.97NTIWNALEE24 pKa = 4.13QQDD27 pKa = 3.91GPYY30 pKa = 10.15VDD32 pKa = 5.56RR33 pKa = 11.84EE34 pKa = 4.09MGMVDD39 pKa = 3.51ASGAGLDD46 pKa = 3.74MTAVAAAVADD56 pKa = 3.53IFVDD60 pKa = 4.98SEE62 pKa = 5.14DD63 pKa = 3.74DD64 pKa = 4.06CSWCHH69 pKa = 6.11SPCAVGGWSEE79 pKa = 3.99PVDD82 pKa = 3.63VGSVVQSEE90 pKa = 4.24PNQEE94 pKa = 4.43GITDD98 pKa = 3.52VV99 pKa = 3.5
MM1 pKa = 7.93SDD3 pKa = 3.41PQSTRR8 pKa = 11.84DD9 pKa = 3.4RR10 pKa = 11.84LIANIEE16 pKa = 3.97NTIWNALEE24 pKa = 4.13QQDD27 pKa = 3.91GPYY30 pKa = 10.15VDD32 pKa = 5.56RR33 pKa = 11.84EE34 pKa = 4.09MGMVDD39 pKa = 3.51ASGAGLDD46 pKa = 3.74MTAVAAAVADD56 pKa = 3.53IFVDD60 pKa = 4.98SEE62 pKa = 5.14DD63 pKa = 3.74DD64 pKa = 4.06CSWCHH69 pKa = 6.11SPCAVGGWSEE79 pKa = 3.99PVDD82 pKa = 3.63VGSVVQSEE90 pKa = 4.24PNQEE94 pKa = 4.43GITDD98 pKa = 3.52VV99 pKa = 3.5
Molecular weight: 10.55 kDa
Isoelectric point according different methods:
Protein with the highest isoelectric point:
>tr|S5Y3Q7|S5Y3Q7_9CAUD Lysin A OS=Mycobacterium phage Jabbawokkie OX=1340820 GN=38 PE=4 SV=1
MM1 pKa = 7.7KK2 pKa = 10.18IHH4 pKa = 5.44VQSRR8 pKa = 11.84GPAGWNATVLFTAGTVYY25 pKa = 10.11TVADD29 pKa = 3.79DD30 pKa = 3.38QGRR33 pKa = 11.84KK34 pKa = 9.22HH35 pKa = 6.73LIDD38 pKa = 3.44TSRR41 pKa = 11.84VAIRR45 pKa = 11.84RR46 pKa = 11.84LSS48 pKa = 3.2
MM1 pKa = 7.7KK2 pKa = 10.18IHH4 pKa = 5.44VQSRR8 pKa = 11.84GPAGWNATVLFTAGTVYY25 pKa = 10.11TVADD29 pKa = 3.79DD30 pKa = 3.38QGRR33 pKa = 11.84KK34 pKa = 9.22HH35 pKa = 6.73LIDD38 pKa = 3.44TSRR41 pKa = 11.84VAIRR45 pKa = 11.84RR46 pKa = 11.84LSS48 pKa = 3.2
Molecular weight: 5.3 kDa
Isoelectric point according different methods:
Peptides (in silico digests for buttom-up proteomics)
Below you can find in silico digests of the whole proteome with Trypsin, Chymotrypsin, Trypsin+LysC, LysN, ArgC proteases suitable for different mass spec machines.| Try ESI |
 |
|---|
| ChTry ESI |
|
|---|
| ArgC ESI |
|
|---|
| LysN ESI |
|
|---|
| TryLysC ESI |
|
|---|
| Try MALDI |
|
|---|
| ChTry MALDI |
|
|---|
| ArgC MALDI |
|
|---|
| LysN MALDI |
|
|---|
| TryLysC MALDI |
|
|---|
| Try LTQ |
|
|---|
| ChTry LTQ |
|
|---|
| ArgC LTQ |
|
|---|
| LysN LTQ |
|
|---|
| TryLysC LTQ |
|
|---|
| Try MSlow |
|
|---|
| ChTry MSlow |
|
|---|
| ArgC MSlow |
|
|---|
| LysN MSlow |
|
|---|
| TryLysC MSlow |
|
|---|
| Try MShigh |
|
|---|
| ChTry MShigh |
|
|---|
| ArgC MShigh |
|
|---|
| LysN MShigh |
|
|---|
| TryLysC MShigh |
|
|---|
General Statistics
Number of major isoforms |
Number of additional isoforms |
Number of all proteins |
Number of amino acids |
Min. Seq. Length |
Max. Seq. Length |
Avg. Seq. Length |
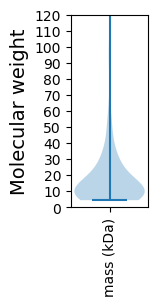
Avg. Mol. Weight |
|---|---|---|---|---|---|---|---|
0 |
17725 |
35 |
1183 |
167.2 |
18.28 |
Amino acid frequency
Ala |
Cys |
Asp |
Glu |
Phe |
Gly |
His |
Ile |
Lys |
Leu |
|---|---|---|---|---|---|---|---|---|---|
10.804 ± 0.404 | 1.371 ± 0.184 |
6.347 ± 0.246 | 6.11 ± 0.331 |
2.872 ± 0.134 | 8.7 ± 0.721 |
2.127 ± 0.15 | 4.48 ± 0.16 |
3.622 ± 0.205 | 7.735 ± 0.257 |
Met |
Asn |
Gln |
Pro |
Arg |
Ser |
Thr |
Val |
Trp |
Tyr |
|---|---|---|---|---|---|---|---|---|---|
2.161 ± 0.145 | 3.069 ± 0.163 |
5.811 ± 0.196 | 3.583 ± 0.227 |
6.894 ± 0.433 | 6.087 ± 0.308 |
6.347 ± 0.304 | 7.25 ± 0.349 |
2.358 ± 0.159 | 2.274 ± 0.136 |
Most of the basic statistics you can see at this page can be downloaded from this CSV file
See this proteome in:

Proteome-pI is available under Creative Commons Attribution-NoDerivs license, for more details see here
| Reference: Kozlowski LP. Proteome-pI 2.0: Proteome Isoelectric Point Database Update. Nucleic Acids Res. 2021, doi: 10.1093/nar/gkab944 | Contact: Lukasz P. Kozlowski |