Microbacterium phage WaterT
Taxonomy: Viruses; Duplodnaviria; Heunggongvirae; Uroviricota; Caudoviricetes; Caudovirales; Siphoviridae; unclassified Siphoviridae
Average proteome isoelectric point is 5.44
Get precalculated fractions of proteins
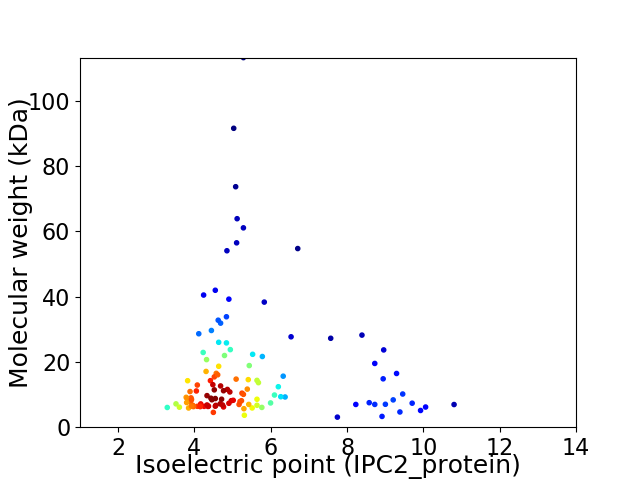
Virtual 2D-PAGE plot for 121 proteins (isoelectric point calculated using IPC2_protein)
Get csv file with sequences according to given criteria:
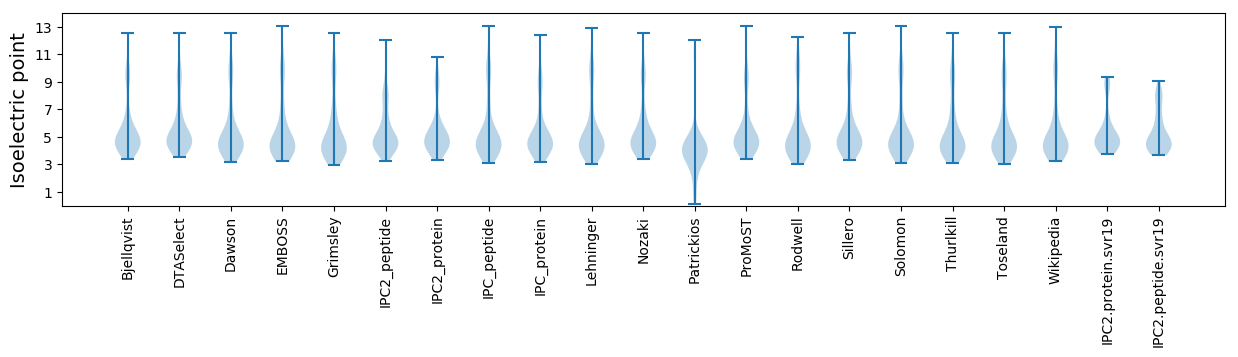
* You can choose from 21 different methods for calculating isoelectric point
Summary statistics related to proteome-wise predictions
Protein with the lowest isoelectric point:
>tr|A0A514TXC2|A0A514TXC2_9CAUD Cas4 family exonuclease OS=Microbacterium phage WaterT OX=2593342 GN=75 PE=4 SV=1
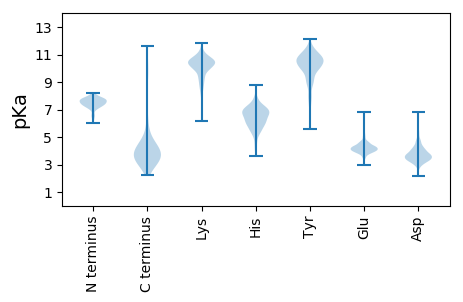
MM1 pKa = 7.18TRR3 pKa = 11.84TVTKK7 pKa = 10.26QGHH10 pKa = 6.56ADD12 pKa = 3.28WDD14 pKa = 4.05DD15 pKa = 5.08LIGKK19 pKa = 8.54SFHH22 pKa = 6.43FLFYY26 pKa = 10.49PGWDD30 pKa = 3.57DD31 pKa = 4.84PEE33 pKa = 4.69WIPITLAGIDD43 pKa = 3.49LTEE46 pKa = 4.47NEE48 pKa = 4.88FGTPIYY54 pKa = 11.18YY55 pKa = 10.99LMDD58 pKa = 4.31EE59 pKa = 4.37NGGGYY64 pKa = 7.68MQFEE68 pKa = 4.65STVVEE73 pKa = 4.48VMLNDD78 pKa = 3.47
MM1 pKa = 7.18TRR3 pKa = 11.84TVTKK7 pKa = 10.26QGHH10 pKa = 6.56ADD12 pKa = 3.28WDD14 pKa = 4.05DD15 pKa = 5.08LIGKK19 pKa = 8.54SFHH22 pKa = 6.43FLFYY26 pKa = 10.49PGWDD30 pKa = 3.57DD31 pKa = 4.84PEE33 pKa = 4.69WIPITLAGIDD43 pKa = 3.49LTEE46 pKa = 4.47NEE48 pKa = 4.88FGTPIYY54 pKa = 11.18YY55 pKa = 10.99LMDD58 pKa = 4.31EE59 pKa = 4.37NGGGYY64 pKa = 7.68MQFEE68 pKa = 4.65STVVEE73 pKa = 4.48VMLNDD78 pKa = 3.47
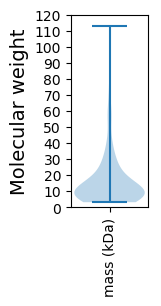
Molecular weight: 8.98 kDa
Isoelectric point according different methods:
Protein with the highest isoelectric point:
>tr|A0A514TX85|A0A514TX85_9CAUD Minor tail protein OS=Microbacterium phage WaterT OX=2593342 GN=39 PE=4 SV=1
MM1 pKa = 7.23KK2 pKa = 10.25FVVPFLRR9 pKa = 11.84ARR11 pKa = 11.84SSTGMVSSLRR21 pKa = 11.84LRR23 pKa = 11.84TPVAVASIVALSRR36 pKa = 11.84LTTTRR41 pKa = 11.84FRR43 pKa = 11.84ILMTSKK49 pKa = 10.81SKK51 pKa = 10.86LLTRR55 pKa = 11.84KK56 pKa = 8.23RR57 pKa = 11.84TKK59 pKa = 10.83DD60 pKa = 3.25GTT62 pKa = 3.74
MM1 pKa = 7.23KK2 pKa = 10.25FVVPFLRR9 pKa = 11.84ARR11 pKa = 11.84SSTGMVSSLRR21 pKa = 11.84LRR23 pKa = 11.84TPVAVASIVALSRR36 pKa = 11.84LTTTRR41 pKa = 11.84FRR43 pKa = 11.84ILMTSKK49 pKa = 10.81SKK51 pKa = 10.86LLTRR55 pKa = 11.84KK56 pKa = 8.23RR57 pKa = 11.84TKK59 pKa = 10.83DD60 pKa = 3.25GTT62 pKa = 3.74
Molecular weight: 6.94 kDa
Isoelectric point according different methods:
Peptides (in silico digests for buttom-up proteomics)
Below you can find in silico digests of the whole proteome with Trypsin, Chymotrypsin, Trypsin+LysC, LysN, ArgC proteases suitable for different mass spec machines.| Try ESI |
 |
|---|
| ChTry ESI |
|
|---|
| ArgC ESI |
|
|---|
| LysN ESI |
|
|---|
| TryLysC ESI |
|
|---|
| Try MALDI |
|
|---|
| ChTry MALDI |
|
|---|
| ArgC MALDI |
|
|---|
| LysN MALDI |
|
|---|
| TryLysC MALDI |
|
|---|
| Try LTQ |
|
|---|
| ChTry LTQ |
|
|---|
| ArgC LTQ |
|
|---|
| LysN LTQ |
|
|---|
| TryLysC LTQ |
|
|---|
| Try MSlow |
|
|---|
| ChTry MSlow |
|
|---|
| ArgC MSlow |
|
|---|
| LysN MSlow |
|
|---|
| TryLysC MSlow |
|
|---|
| Try MShigh |
|
|---|
| ChTry MShigh |
|
|---|
| ArgC MShigh |
|
|---|
| LysN MShigh |
|
|---|
| TryLysC MShigh |
|
|---|
General Statistics
Number of major isoforms |
Number of additional isoforms |
Number of all proteins |
Number of amino acids |
Min. Seq. Length |
Max. Seq. Length |
Avg. Seq. Length |
Avg. Mol. Weight |
|---|---|---|---|---|---|---|---|
0 |
18373 |
30 |
1085 |
151.8 |
16.76 |
Amino acid frequency
Ala |
Cys |
Asp |
Glu |
Phe |
Gly |
His |
Ile |
Lys |
Leu |
|---|---|---|---|---|---|---|---|---|---|
9.77 ± 0.544 | 0.544 ± 0.1 |
6.754 ± 0.262 | 7.092 ± 0.333 |
3.576 ± 0.128 | 8.502 ± 0.315 |
1.502 ± 0.144 | 4.991 ± 0.158 |
4.185 ± 0.239 | 7.522 ± 0.233 |
Met |
Asn |
Gln |
Pro |
Arg |
Ser |
Thr |
Val |
Trp |
Tyr |
|---|---|---|---|---|---|---|---|---|---|
2.368 ± 0.136 | 3.826 ± 0.209 |
4.392 ± 0.294 | 3.222 ± 0.243 |
5.813 ± 0.237 | 6.352 ± 0.251 |
6.733 ± 0.316 | 7.19 ± 0.237 |
2.134 ± 0.149 | 3.532 ± 0.166 |
Most of the basic statistics you can see at this page can be downloaded from this CSV file
See this proteome in:

Proteome-pI is available under Creative Commons Attribution-NoDerivs license, for more details see here
| Reference: Kozlowski LP. Proteome-pI 2.0: Proteome Isoelectric Point Database Update. Nucleic Acids Res. 2021, doi: 10.1093/nar/gkab944 | Contact: Lukasz P. Kozlowski |