Asaia bogorensis
Taxonomy: cellular organisms; Bacteria; Proteobacteria; Alphaproteobacteria; Rhodospirillales; Acetobacteraceae; Asaia
Average proteome isoelectric point is 6.71
Get precalculated fractions of proteins
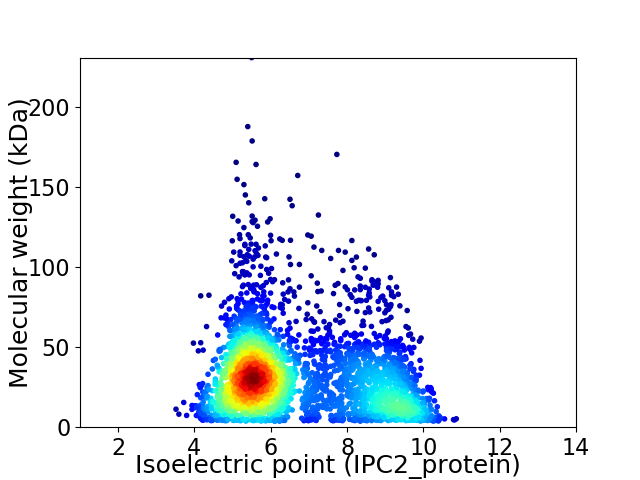
Virtual 2D-PAGE plot for 3273 proteins (isoelectric point calculated using IPC2_protein)
Get csv file with sequences according to given criteria:
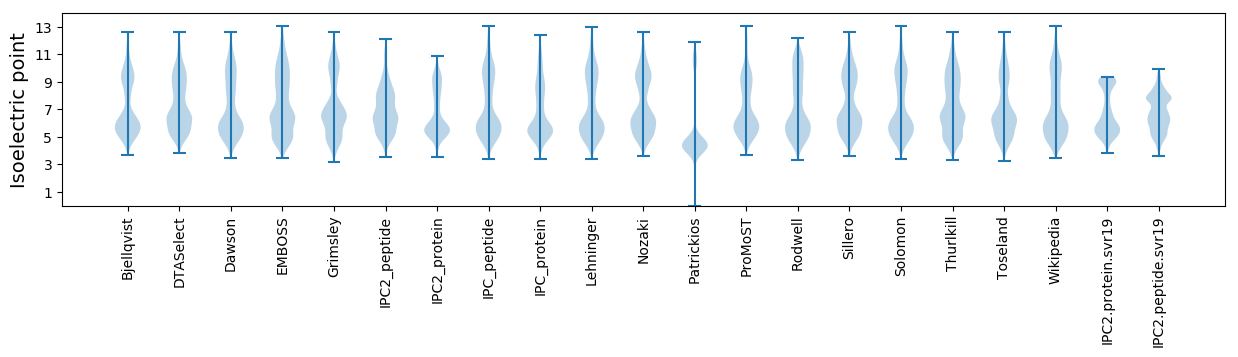
* You can choose from 21 different methods for calculating isoelectric point
Summary statistics related to proteome-wise predictions
Protein with the lowest isoelectric point:
>tr|A0A060QKR7|A0A060QKR7_9PROT FGGY_N domain-containing protein OS=Asaia bogorensis OX=91915 GN=ASAP_2101 PE=4 SV=1
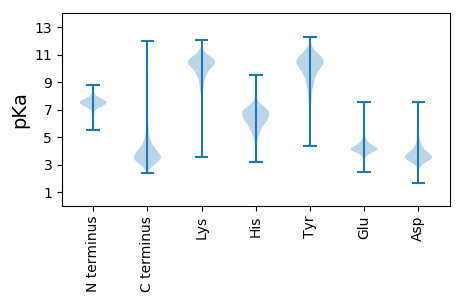
MM1 pKa = 7.84NDD3 pKa = 2.66TSMNSVQIATDD14 pKa = 4.09PAAHH18 pKa = 7.27AYY20 pKa = 10.27AIIDD24 pKa = 3.46ASGEE28 pKa = 4.25VVNRR32 pKa = 11.84IVWDD36 pKa = 3.71GRR38 pKa = 11.84GNLILPTGQYY48 pKa = 8.49WVEE51 pKa = 4.51DD52 pKa = 4.03DD53 pKa = 4.04ASAYY57 pKa = 9.84PIGSTYY63 pKa = 10.57KK64 pKa = 10.79APTPTSGTAGG74 pKa = 3.28
MM1 pKa = 7.84NDD3 pKa = 2.66TSMNSVQIATDD14 pKa = 4.09PAAHH18 pKa = 7.27AYY20 pKa = 10.27AIIDD24 pKa = 3.46ASGEE28 pKa = 4.25VVNRR32 pKa = 11.84IVWDD36 pKa = 3.71GRR38 pKa = 11.84GNLILPTGQYY48 pKa = 8.49WVEE51 pKa = 4.51DD52 pKa = 4.03DD53 pKa = 4.04ASAYY57 pKa = 9.84PIGSTYY63 pKa = 10.57KK64 pKa = 10.79APTPTSGTAGG74 pKa = 3.28
Molecular weight: 7.77 kDa
Isoelectric point according different methods:
Protein with the highest isoelectric point:
>tr|A0A060QCE0|A0A060QCE0_9PROT Oxidoreductase OS=Asaia bogorensis OX=91915 GN=ASAP_0744 PE=4 SV=1
MM1 pKa = 7.39RR2 pKa = 11.84RR3 pKa = 11.84AIVFVLSVSANQNVIVTNQVRR24 pKa = 11.84TLAFALRR31 pKa = 11.84GRR33 pKa = 11.84LHH35 pKa = 6.69HH36 pKa = 6.47ATPISS41 pKa = 3.35
MM1 pKa = 7.39RR2 pKa = 11.84RR3 pKa = 11.84AIVFVLSVSANQNVIVTNQVRR24 pKa = 11.84TLAFALRR31 pKa = 11.84GRR33 pKa = 11.84LHH35 pKa = 6.69HH36 pKa = 6.47ATPISS41 pKa = 3.35
Molecular weight: 4.56 kDa
Isoelectric point according different methods:
Peptides (in silico digests for buttom-up proteomics)
Below you can find in silico digests of the whole proteome with Trypsin, Chymotrypsin, Trypsin+LysC, LysN, ArgC proteases suitable for different mass spec machines.| Try ESI |
 |
|---|
| ChTry ESI |
|
|---|
| ArgC ESI |
|
|---|
| LysN ESI |
|
|---|
| TryLysC ESI |
|
|---|
| Try MALDI |
|
|---|
| ChTry MALDI |
|
|---|
| ArgC MALDI |
|
|---|
| LysN MALDI |
|
|---|
| TryLysC MALDI |
|
|---|
| Try LTQ |
|
|---|
| ChTry LTQ |
|
|---|
| ArgC LTQ |
|
|---|
| LysN LTQ |
|
|---|
| TryLysC LTQ |
|
|---|
| Try MSlow |
|
|---|
| ChTry MSlow |
|
|---|
| ArgC MSlow |
|
|---|
| LysN MSlow |
|
|---|
| TryLysC MSlow |
|
|---|
| Try MShigh |
|
|---|
| ChTry MShigh |
|
|---|
| ArgC MShigh |
|
|---|
| LysN MShigh |
|
|---|
| TryLysC MShigh |
|
|---|
General Statistics
Number of major isoforms |
Number of additional isoforms |
Number of all proteins |
Number of amino acids |
Min. Seq. Length |
Max. Seq. Length |
Avg. Seq. Length |
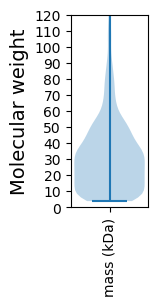
Avg. Mol. Weight |
|---|---|---|---|---|---|---|---|
0 |
1008756 |
37 |
2114 |
308.2 |
33.49 |
Amino acid frequency
Ala |
Cys |
Asp |
Glu |
Phe |
Gly |
His |
Ile |
Lys |
Leu |
|---|---|---|---|---|---|---|---|---|---|
11.834 ± 0.058 | 1.027 ± 0.014 |
5.537 ± 0.035 | 5.122 ± 0.044 |
3.495 ± 0.027 | 8.48 ± 0.04 |
2.494 ± 0.02 | 5.138 ± 0.028 |
2.767 ± 0.032 | 10.459 ± 0.055 |
Met |
Asn |
Gln |
Pro |
Arg |
Ser |
Thr |
Val |
Trp |
Tyr |
|---|---|---|---|---|---|---|---|---|---|
2.569 ± 0.021 | 2.697 ± 0.033 |
5.45 ± 0.033 | 3.594 ± 0.025 |
7.204 ± 0.046 | 6.044 ± 0.039 |
5.692 ± 0.036 | 6.743 ± 0.034 |
1.384 ± 0.017 | 2.255 ± 0.029 |
Most of the basic statistics you can see at this page can be downloaded from this CSV file
See this proteome in:

Proteome-pI is available under Creative Commons Attribution-NoDerivs license, for more details see here
| Reference: Kozlowski LP. Proteome-pI 2.0: Proteome Isoelectric Point Database Update. Nucleic Acids Res. 2021, doi: 10.1093/nar/gkab944 | Contact: Lukasz P. Kozlowski |