Streptomyces phage Satis
Taxonomy: Viruses; Duplodnaviria; Heunggongvirae; Uroviricota; Caudoviricetes; Caudovirales; Siphoviridae; unclassified Siphoviridae
Average proteome isoelectric point is 6.04
Get precalculated fractions of proteins
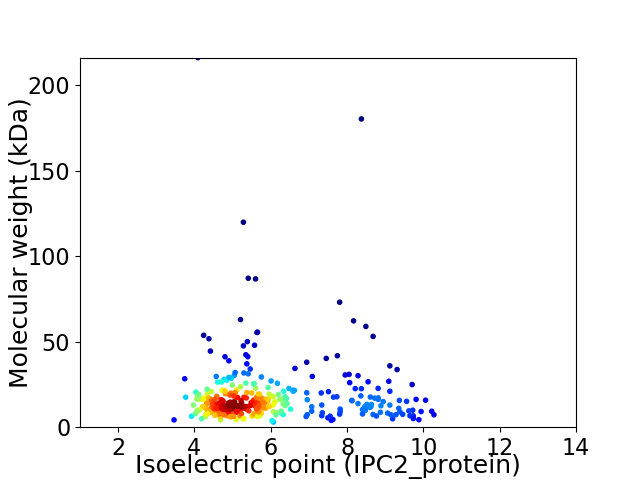
Virtual 2D-PAGE plot for 325 proteins (isoelectric point calculated using IPC2_protein)
Get csv file with sequences according to given criteria:
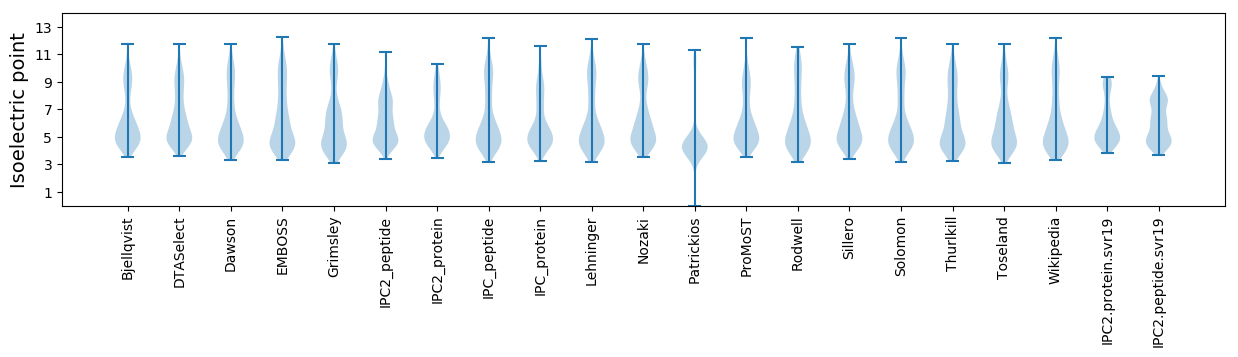
* You can choose from 21 different methods for calculating isoelectric point
Summary statistics related to proteome-wise predictions
Protein with the lowest isoelectric point:
>tr|A0A345M760|A0A345M760_9CAUD Hydrolase OS=Streptomyces phage Satis OX=2283264 GN=172 PE=4 SV=1
MM1 pKa = 8.23DD2 pKa = 3.7VLTWINTLVLGAVLVFGWIKK22 pKa = 10.35LANGDD27 pKa = 4.29EE28 pKa = 4.45ADD30 pKa = 3.87GCCAVILLVLTVGLAALGFLAYY52 pKa = 10.03GVGSLIGWWW61 pKa = 3.26
MM1 pKa = 8.23DD2 pKa = 3.7VLTWINTLVLGAVLVFGWIKK22 pKa = 10.35LANGDD27 pKa = 4.29EE28 pKa = 4.45ADD30 pKa = 3.87GCCAVILLVLTVGLAALGFLAYY52 pKa = 10.03GVGSLIGWWW61 pKa = 3.26
Molecular weight: 6.39 kDa
Isoelectric point according different methods:
Protein with the highest isoelectric point:
>tr|A0A345M6X8|A0A345M6X8_9CAUD Uncharacterized protein OS=Streptomyces phage Satis OX=2283264 GN=88 PE=4 SV=1
MM1 pKa = 7.41MNTNPNDD8 pKa = 3.89PLVSIAEE15 pKa = 4.13AASRR19 pKa = 11.84MGVKK23 pKa = 10.24VGRR26 pKa = 11.84ARR28 pKa = 11.84SILAKK33 pKa = 10.54NLVRR37 pKa = 11.84PVRR40 pKa = 11.84TPAGIAYY47 pKa = 9.86RR48 pKa = 11.84LEE50 pKa = 4.25DD51 pKa = 3.53VVEE54 pKa = 4.55TKK56 pKa = 10.62RR57 pKa = 11.84MYY59 pKa = 10.12QQ60 pKa = 3.04
MM1 pKa = 7.41MNTNPNDD8 pKa = 3.89PLVSIAEE15 pKa = 4.13AASRR19 pKa = 11.84MGVKK23 pKa = 10.24VGRR26 pKa = 11.84ARR28 pKa = 11.84SILAKK33 pKa = 10.54NLVRR37 pKa = 11.84PVRR40 pKa = 11.84TPAGIAYY47 pKa = 9.86RR48 pKa = 11.84LEE50 pKa = 4.25DD51 pKa = 3.53VVEE54 pKa = 4.55TKK56 pKa = 10.62RR57 pKa = 11.84MYY59 pKa = 10.12QQ60 pKa = 3.04
Molecular weight: 6.66 kDa
Isoelectric point according different methods:
Peptides (in silico digests for buttom-up proteomics)
Below you can find in silico digests of the whole proteome with Trypsin, Chymotrypsin, Trypsin+LysC, LysN, ArgC proteases suitable for different mass spec machines.| Try ESI |
 |
|---|
| ChTry ESI |
|
|---|
| ArgC ESI |
|
|---|
| LysN ESI |
|
|---|
| TryLysC ESI |
|
|---|
| Try MALDI |
|
|---|
| ChTry MALDI |
|
|---|
| ArgC MALDI |
|
|---|
| LysN MALDI |
|
|---|
| TryLysC MALDI |
|
|---|
| Try LTQ |
|
|---|
| ChTry LTQ |
|
|---|
| ArgC LTQ |
|
|---|
| LysN LTQ |
|
|---|
| TryLysC LTQ |
|
|---|
| Try MSlow |
|
|---|
| ChTry MSlow |
|
|---|
| ArgC MSlow |
|
|---|
| LysN MSlow |
|
|---|
| TryLysC MSlow |
|
|---|
| Try MShigh |
|
|---|
| ChTry MShigh |
|
|---|
| ArgC MShigh |
|
|---|
| LysN MShigh |
|
|---|
| TryLysC MShigh |
|
|---|
General Statistics
Number of major isoforms |
Number of additional isoforms |
Number of all proteins |
Number of amino acids |
Min. Seq. Length |
Max. Seq. Length |
Avg. Seq. Length |
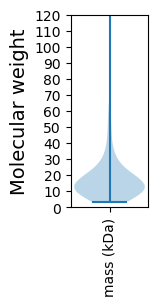
Avg. Mol. Weight |
|---|---|---|---|---|---|---|---|
0 |
55137 |
26 |
2111 |
169.7 |
18.64 |
Amino acid frequency
Ala |
Cys |
Asp |
Glu |
Phe |
Gly |
His |
Ile |
Lys |
Leu |
|---|---|---|---|---|---|---|---|---|---|
10.182 ± 0.348 | 1.105 ± 0.08 |
6.388 ± 0.124 | 7.204 ± 0.208 |
2.869 ± 0.077 | 8.833 ± 0.263 |
2.167 ± 0.102 | 4.09 ± 0.09 |
4.117 ± 0.166 | 8.16 ± 0.151 |
Met |
Asn |
Gln |
Pro |
Arg |
Ser |
Thr |
Val |
Trp |
Tyr |
|---|---|---|---|---|---|---|---|---|---|
2.655 ± 0.092 | 2.867 ± 0.108 |
5.432 ± 0.159 | 3.223 ± 0.139 |
6.979 ± 0.206 | 5.724 ± 0.163 |
6.09 ± 0.154 | 7.416 ± 0.136 |
1.935 ± 0.089 | 2.565 ± 0.086 |
Most of the basic statistics you can see at this page can be downloaded from this CSV file
See this proteome in:

Proteome-pI is available under Creative Commons Attribution-NoDerivs license, for more details see here
| Reference: Kozlowski LP. Proteome-pI 2.0: Proteome Isoelectric Point Database Update. Nucleic Acids Res. 2021, doi: 10.1093/nar/gkab944 | Contact: Lukasz P. Kozlowski |