Inhella crocodyli
Taxonomy: cellular organisms; Bacteria; Proteobacteria; Betaproteobacteria; Burkholderiales; Burkholderiales genera incertae sedis; Inhella
Average proteome isoelectric point is 7.1
Get precalculated fractions of proteins
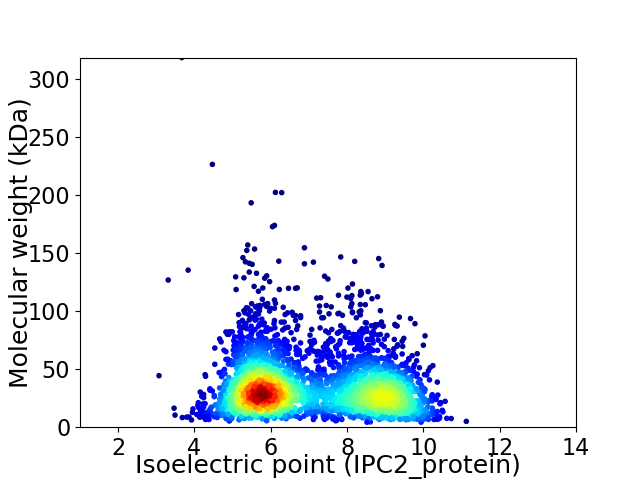
Virtual 2D-PAGE plot for 3430 proteins (isoelectric point calculated using IPC2_protein)
Get csv file with sequences according to given criteria:
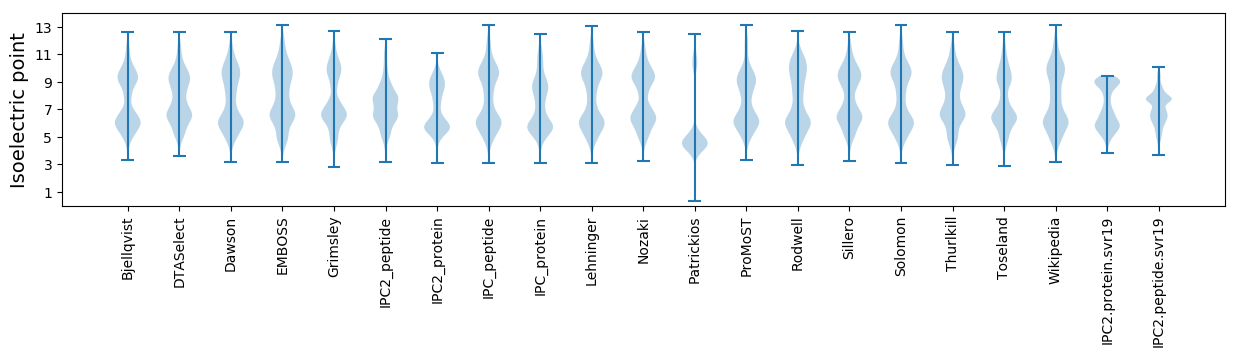
* You can choose from 21 different methods for calculating isoelectric point
Summary statistics related to proteome-wise predictions
Protein with the lowest isoelectric point:
>tr|A0A3S2URV5|A0A3S2URV5_9BURK Uncharacterized protein OS=Inhella crocodyli OX=2499851 GN=EOD73_15270 PE=4 SV=1
DDD2 pKa = 4.01AVVTGVATGSVTEEE16 pKa = 5.08DD17 pKa = 3.39TVLASGTLIVSDDD30 pKa = 3.85DDD32 pKa = 3.63ATTVVPGSVAGTYYY46 pKa = 11.19DDD48 pKa = 3.76TINAAGQWTYYY59 pKa = 7.64LRR61 pKa = 11.84NGAANVQALTSADDD75 pKa = 3.7HH76 pKa = 6.29VEEE79 pKa = 4.34FTVTT
DDD2 pKa = 4.01AVVTGVATGSVTEEE16 pKa = 5.08DD17 pKa = 3.39TVLASGTLIVSDDD30 pKa = 3.85DDD32 pKa = 3.63ATTVVPGSVAGTYYY46 pKa = 11.19DDD48 pKa = 3.76TINAAGQWTYYY59 pKa = 7.64LRR61 pKa = 11.84NGAANVQALTSADDD75 pKa = 3.7HH76 pKa = 6.29VEEE79 pKa = 4.34FTVTT
Molecular weight: 8.32 kDa
Isoelectric point according different methods:
Protein with the highest isoelectric point:
>tr|A0A437LHS8|A0A437LHS8_9BURK Cytochrome P450 OS=Inhella crocodyli OX=2499851 GN=EOD73_12575 PE=3 SV=1
MM1 pKa = 7.31KK2 pKa = 9.39RR3 pKa = 11.84TYY5 pKa = 10.12QGSKK9 pKa = 7.18VRR11 pKa = 11.84RR12 pKa = 11.84ARR14 pKa = 11.84THH16 pKa = 5.65GFLVRR21 pKa = 11.84MKK23 pKa = 10.53SRR25 pKa = 11.84GGRR28 pKa = 11.84AVLAARR34 pKa = 11.84RR35 pKa = 11.84AKK37 pKa = 9.87GRR39 pKa = 11.84KK40 pKa = 8.75RR41 pKa = 11.84LAVV44 pKa = 3.41
MM1 pKa = 7.31KK2 pKa = 9.39RR3 pKa = 11.84TYY5 pKa = 10.12QGSKK9 pKa = 7.18VRR11 pKa = 11.84RR12 pKa = 11.84ARR14 pKa = 11.84THH16 pKa = 5.65GFLVRR21 pKa = 11.84MKK23 pKa = 10.53SRR25 pKa = 11.84GGRR28 pKa = 11.84AVLAARR34 pKa = 11.84RR35 pKa = 11.84AKK37 pKa = 9.87GRR39 pKa = 11.84KK40 pKa = 8.75RR41 pKa = 11.84LAVV44 pKa = 3.41
Molecular weight: 5.04 kDa
Isoelectric point according different methods:
Peptides (in silico digests for buttom-up proteomics)
Below you can find in silico digests of the whole proteome with Trypsin, Chymotrypsin, Trypsin+LysC, LysN, ArgC proteases suitable for different mass spec machines.| Try ESI |
 |
|---|
| ChTry ESI |
|
|---|
| ArgC ESI |
|
|---|
| LysN ESI |
|
|---|
| TryLysC ESI |
|
|---|
| Try MALDI |
|
|---|
| ChTry MALDI |
|
|---|
| ArgC MALDI |
|
|---|
| LysN MALDI |
|
|---|
| TryLysC MALDI |
|
|---|
| Try LTQ |
|
|---|
| ChTry LTQ |
|
|---|
| ArgC LTQ |
|
|---|
| LysN LTQ |
|
|---|
| TryLysC LTQ |
|
|---|
| Try MSlow |
|
|---|
| ChTry MSlow |
|
|---|
| ArgC MSlow |
|
|---|
| LysN MSlow |
|
|---|
| TryLysC MSlow |
|
|---|
| Try MShigh |
|
|---|
| ChTry MShigh |
|
|---|
| ArgC MShigh |
|
|---|
| LysN MShigh |
|
|---|
| TryLysC MShigh |
|
|---|
General Statistics
Number of major isoforms |
Number of additional isoforms |
Number of all proteins |
Number of amino acids |
Min. Seq. Length |
Max. Seq. Length |
Avg. Seq. Length |
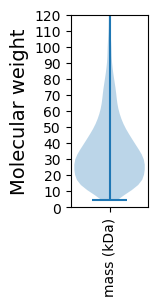
Avg. Mol. Weight |
|---|---|---|---|---|---|---|---|
0 |
1173898 |
37 |
3140 |
342.2 |
37.03 |
Amino acid frequency
Ala |
Cys |
Asp |
Glu |
Phe |
Gly |
His |
Ile |
Lys |
Leu |
|---|---|---|---|---|---|---|---|---|---|
13.969 ± 0.066 | 0.856 ± 0.013 |
5.241 ± 0.028 | 5.106 ± 0.037 |
3.191 ± 0.024 | 8.462 ± 0.035 |
2.357 ± 0.025 | 3.192 ± 0.031 |
2.814 ± 0.035 | 11.679 ± 0.058 |
Met |
Asn |
Gln |
Pro |
Arg |
Ser |
Thr |
Val |
Trp |
Tyr |
|---|---|---|---|---|---|---|---|---|---|
2.136 ± 0.018 | 2.264 ± 0.031 |
5.768 ± 0.04 | 4.487 ± 0.027 |
7.46 ± 0.047 | 4.857 ± 0.036 |
4.85 ± 0.046 | 7.631 ± 0.031 |
1.831 ± 0.024 | 1.85 ± 0.019 |
Most of the basic statistics you can see at this page can be downloaded from this CSV file
See this proteome in:

Proteome-pI is available under Creative Commons Attribution-NoDerivs license, for more details see here
| Reference: Kozlowski LP. Proteome-pI 2.0: Proteome Isoelectric Point Database Update. Nucleic Acids Res. 2021, doi: 10.1093/nar/gkab944 | Contact: Lukasz P. Kozlowski |