Geobacillus virus E2
Taxonomy: Viruses; Duplodnaviria; Heunggongvirae; Uroviricota; Caudoviricetes; Caudovirales; Siphoviridae; unclassified Siphoviridae
Average proteome isoelectric point is 6.43
Get precalculated fractions of proteins
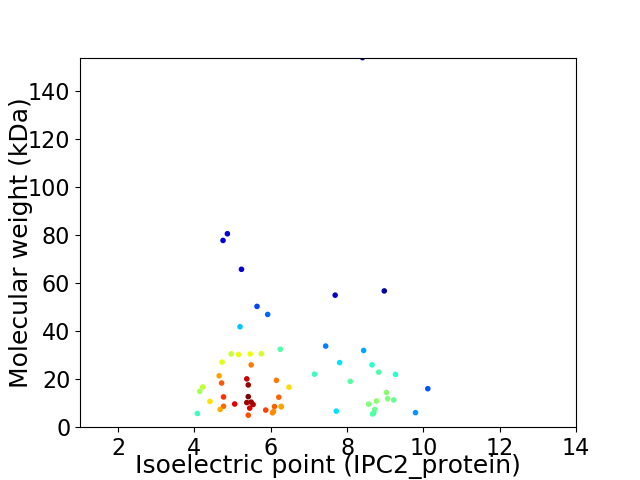
Virtual 2D-PAGE plot for 62 proteins (isoelectric point calculated using IPC2_protein)
Get csv file with sequences according to given criteria:
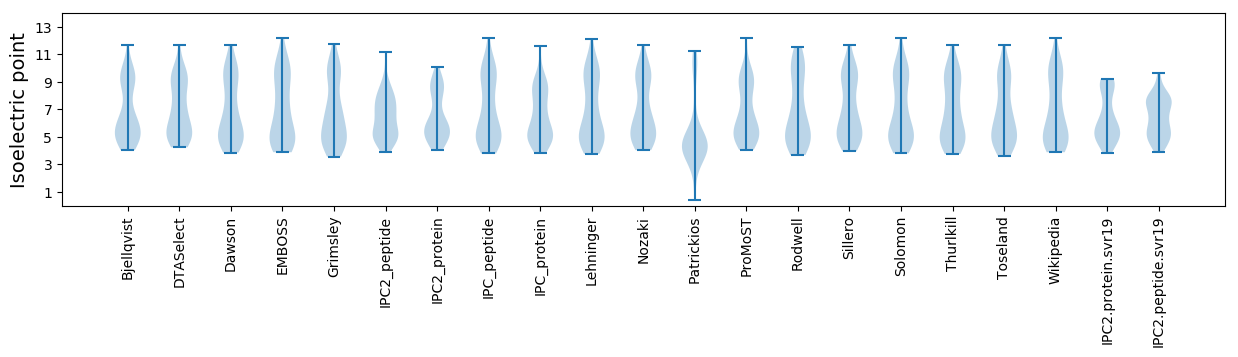
* You can choose from 21 different methods for calculating isoelectric point
Summary statistics related to proteome-wise predictions
Protein with the lowest isoelectric point:
>tr|A6M9A8|A6M9A8_9CAUD Uncharacterized protein OS=Geobacillus virus E2 OX=447909 PE=4 SV=1
MM1 pKa = 7.78FIGLGLGVGTVILIQLIVDD20 pKa = 4.16LFKK23 pKa = 11.56DD24 pKa = 3.41EE25 pKa = 4.32FTDD28 pKa = 3.95FRR30 pKa = 11.84WYY32 pKa = 10.62LICTCIMLLCFALDD46 pKa = 3.98VVWGG50 pKa = 3.86
MM1 pKa = 7.78FIGLGLGVGTVILIQLIVDD20 pKa = 4.16LFKK23 pKa = 11.56DD24 pKa = 3.41EE25 pKa = 4.32FTDD28 pKa = 3.95FRR30 pKa = 11.84WYY32 pKa = 10.62LICTCIMLLCFALDD46 pKa = 3.98VVWGG50 pKa = 3.86
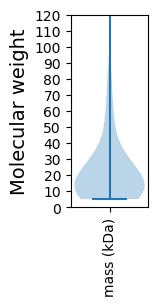
Molecular weight: 5.72 kDa
Isoelectric point according different methods:
Protein with the highest isoelectric point:
>tr|A6M9A7|A6M9A7_9CAUD Uncharacterized protein OS=Geobacillus virus E2 OX=447909 PE=4 SV=1
MM1 pKa = 7.72LFTSNKK7 pKa = 8.2NATPFGVTLFGLQRR21 pKa = 11.84DD22 pKa = 3.77RR23 pKa = 11.84QRR25 pKa = 11.84IYY27 pKa = 9.33EE28 pKa = 4.14KK29 pKa = 10.59EE30 pKa = 3.73RR31 pKa = 11.84SRR33 pKa = 11.84CAGYY37 pKa = 10.71EE38 pKa = 3.72RR39 pKa = 11.84TTRR42 pKa = 11.84TTIKK46 pKa = 10.71LMDD49 pKa = 4.11SDD51 pKa = 4.64FPPGIFAINFIPCPITFQLPAATRR75 pKa = 11.84ARR77 pKa = 11.84HH78 pKa = 6.11LFQFMPRR85 pKa = 11.84LQCLGVKK92 pKa = 9.21TIIACWRR99 pKa = 11.84CEE101 pKa = 3.77FF102 pKa = 4.69
MM1 pKa = 7.72LFTSNKK7 pKa = 8.2NATPFGVTLFGLQRR21 pKa = 11.84DD22 pKa = 3.77RR23 pKa = 11.84QRR25 pKa = 11.84IYY27 pKa = 9.33EE28 pKa = 4.14KK29 pKa = 10.59EE30 pKa = 3.73RR31 pKa = 11.84SRR33 pKa = 11.84CAGYY37 pKa = 10.71EE38 pKa = 3.72RR39 pKa = 11.84TTRR42 pKa = 11.84TTIKK46 pKa = 10.71LMDD49 pKa = 4.11SDD51 pKa = 4.64FPPGIFAINFIPCPITFQLPAATRR75 pKa = 11.84ARR77 pKa = 11.84HH78 pKa = 6.11LFQFMPRR85 pKa = 11.84LQCLGVKK92 pKa = 9.21TIIACWRR99 pKa = 11.84CEE101 pKa = 3.77FF102 pKa = 4.69
Molecular weight: 11.87 kDa
Isoelectric point according different methods:
Peptides (in silico digests for buttom-up proteomics)
Below you can find in silico digests of the whole proteome with Trypsin, Chymotrypsin, Trypsin+LysC, LysN, ArgC proteases suitable for different mass spec machines.| Try ESI |
 |
|---|
| ChTry ESI |
|
|---|
| ArgC ESI |
|
|---|
| LysN ESI |
|
|---|
| TryLysC ESI |
|
|---|
| Try MALDI |
|
|---|
| ChTry MALDI |
|
|---|
| ArgC MALDI |
|
|---|
| LysN MALDI |
|
|---|
| TryLysC MALDI |
|
|---|
| Try LTQ |
|
|---|
| ChTry LTQ |
|
|---|
| ArgC LTQ |
|
|---|
| LysN LTQ |
|
|---|
| TryLysC LTQ |
|
|---|
| Try MSlow |
|
|---|
| ChTry MSlow |
|
|---|
| ArgC MSlow |
|
|---|
| LysN MSlow |
|
|---|
| TryLysC MSlow |
|
|---|
| Try MShigh |
|
|---|
| ChTry MShigh |
|
|---|
| ArgC MShigh |
|
|---|
| LysN MShigh |
|
|---|
| TryLysC MShigh |
|
|---|
General Statistics
Number of major isoforms |
Number of additional isoforms |
Number of all proteins |
Number of amino acids |
Min. Seq. Length |
Max. Seq. Length |
Avg. Seq. Length |
Avg. Mol. Weight |
|---|---|---|---|---|---|---|---|
0 |
12807 |
44 |
1415 |
206.6 |
23.53 |
Amino acid frequency
Ala |
Cys |
Asp |
Glu |
Phe |
Gly |
His |
Ile |
Lys |
Leu |
|---|---|---|---|---|---|---|---|---|---|
7.605 ± 0.684 | 0.953 ± 0.171 |
5.739 ± 0.376 | 7.957 ± 0.485 |
4.349 ± 0.318 | 6.059 ± 0.315 |
1.382 ± 0.151 | 6.934 ± 0.269 |
7.754 ± 0.392 | 8.347 ± 0.459 |
Met |
Asn |
Gln |
Pro |
Arg |
Ser |
Thr |
Val |
Trp |
Tyr |
|---|---|---|---|---|---|---|---|---|---|
2.624 ± 0.213 | 4.989 ± 0.51 |
3.1 ± 0.246 | 4.17 ± 0.29 |
5.364 ± 0.372 | 5.349 ± 0.4 |
5.747 ± 0.27 | 6.169 ± 0.255 |
1.366 ± 0.101 | 4.045 ± 0.325 |
Most of the basic statistics you can see at this page can be downloaded from this CSV file
See this proteome in:

Proteome-pI is available under Creative Commons Attribution-NoDerivs license, for more details see here
| Reference: Kozlowski LP. Proteome-pI 2.0: Proteome Isoelectric Point Database Update. Nucleic Acids Res. 2021, doi: 10.1093/nar/gkab944 | Contact: Lukasz P. Kozlowski |