Acinetobacter phage AbP2
Taxonomy: Viruses; Duplodnaviria; Heunggongvirae; Uroviricota; Caudoviricetes; Caudovirales; Myoviridae; Obolenskvirus; Acinetobacter virus AbP2
Average proteome isoelectric point is 6.3
Get precalculated fractions of proteins
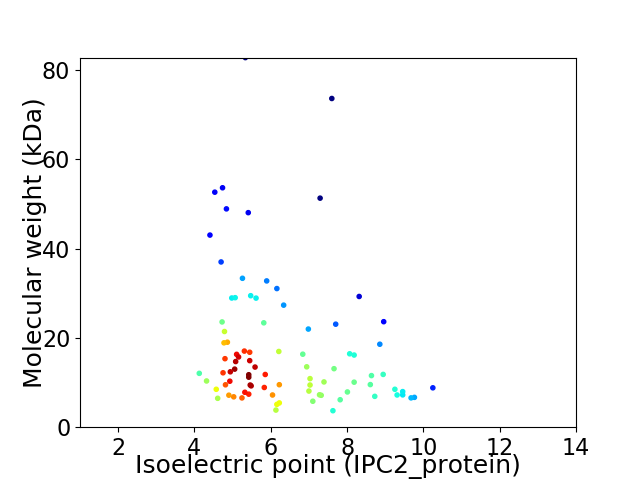
Virtual 2D-PAGE plot for 88 proteins (isoelectric point calculated using IPC2_protein)
Get csv file with sequences according to given criteria:
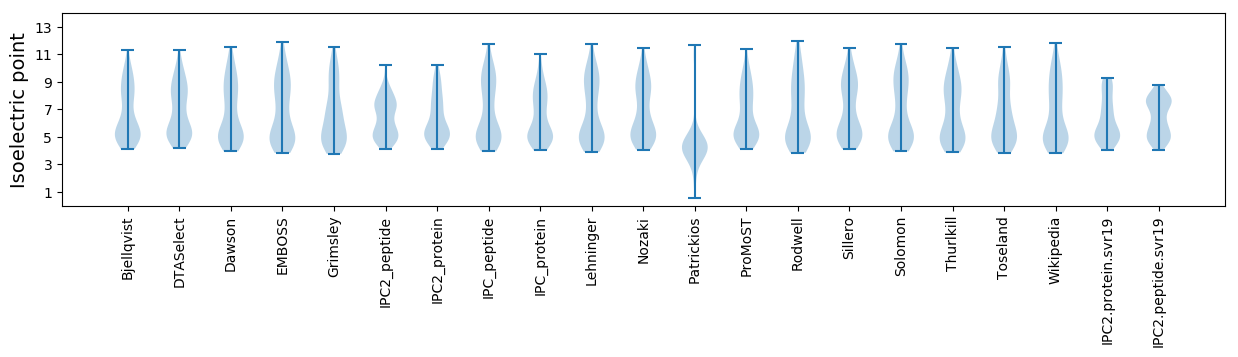
* You can choose from 21 different methods for calculating isoelectric point
Summary statistics related to proteome-wise predictions
Protein with the lowest isoelectric point:
>tr|A0A220NQH6|A0A220NQH6_9CAUD Putative tail fiber protein OS=Acinetobacter phage AbP2 OX=2015804 GN=ABP2_030 PE=4 SV=1
MM1 pKa = 7.9IYY3 pKa = 9.92QIPLAQVPNQFFTTSLNGVTWAITLEE29 pKa = 4.08TRR31 pKa = 11.84LNNLYY36 pKa = 10.27ISLSNNNDD44 pKa = 2.72GDD46 pKa = 3.93VLLNRR51 pKa = 11.84ICLNRR56 pKa = 11.84TYY58 pKa = 10.23LGHH61 pKa = 6.75GFIFVDD67 pKa = 3.51IDD69 pKa = 3.79GNSDD73 pKa = 3.53PEE75 pKa = 4.25YY76 pKa = 9.62TGLGTRR82 pKa = 11.84YY83 pKa = 10.14LLIWTDD89 pKa = 3.71EE90 pKa = 4.13VV91 pKa = 3.51
MM1 pKa = 7.9IYY3 pKa = 9.92QIPLAQVPNQFFTTSLNGVTWAITLEE29 pKa = 4.08TRR31 pKa = 11.84LNNLYY36 pKa = 10.27ISLSNNNDD44 pKa = 2.72GDD46 pKa = 3.93VLLNRR51 pKa = 11.84ICLNRR56 pKa = 11.84TYY58 pKa = 10.23LGHH61 pKa = 6.75GFIFVDD67 pKa = 3.51IDD69 pKa = 3.79GNSDD73 pKa = 3.53PEE75 pKa = 4.25YY76 pKa = 9.62TGLGTRR82 pKa = 11.84YY83 pKa = 10.14LLIWTDD89 pKa = 3.71EE90 pKa = 4.13VV91 pKa = 3.51
Molecular weight: 10.36 kDa
Isoelectric point according different methods:
Protein with the highest isoelectric point:
>tr|A0A220NQP3|A0A220NQP3_9CAUD Putative DNA-binding protein OS=Acinetobacter phage AbP2 OX=2015804 GN=ABP2_085 PE=4 SV=1
MM1 pKa = 7.62SKK3 pKa = 10.18PATSFLFLGEE13 pKa = 4.39LKK15 pKa = 10.68LLEE18 pKa = 4.07STIIEE23 pKa = 4.01NTKK26 pKa = 8.23RR27 pKa = 11.84TKK29 pKa = 10.5VRR31 pKa = 11.84DD32 pKa = 3.78AIRR35 pKa = 11.84RR36 pKa = 11.84YY37 pKa = 10.37GDD39 pKa = 3.17RR40 pKa = 11.84KK41 pKa = 10.6FNTTQVGNNVIVTRR55 pKa = 11.84IQQ57 pKa = 2.88
MM1 pKa = 7.62SKK3 pKa = 10.18PATSFLFLGEE13 pKa = 4.39LKK15 pKa = 10.68LLEE18 pKa = 4.07STIIEE23 pKa = 4.01NTKK26 pKa = 8.23RR27 pKa = 11.84TKK29 pKa = 10.5VRR31 pKa = 11.84DD32 pKa = 3.78AIRR35 pKa = 11.84RR36 pKa = 11.84YY37 pKa = 10.37GDD39 pKa = 3.17RR40 pKa = 11.84KK41 pKa = 10.6FNTTQVGNNVIVTRR55 pKa = 11.84IQQ57 pKa = 2.88
Molecular weight: 6.57 kDa
Isoelectric point according different methods:
Peptides (in silico digests for buttom-up proteomics)
Below you can find in silico digests of the whole proteome with Trypsin, Chymotrypsin, Trypsin+LysC, LysN, ArgC proteases suitable for different mass spec machines.| Try ESI |
 |
|---|
| ChTry ESI |
|
|---|
| ArgC ESI |
|
|---|
| LysN ESI |
|
|---|
| TryLysC ESI |
|
|---|
| Try MALDI |
|
|---|
| ChTry MALDI |
|
|---|
| ArgC MALDI |
|
|---|
| LysN MALDI |
|
|---|
| TryLysC MALDI |
|
|---|
| Try LTQ |
|
|---|
| ChTry LTQ |
|
|---|
| ArgC LTQ |
|
|---|
| LysN LTQ |
|
|---|
| TryLysC LTQ |
|
|---|
| Try MSlow |
|
|---|
| ChTry MSlow |
|
|---|
| ArgC MSlow |
|
|---|
| LysN MSlow |
|
|---|
| TryLysC MSlow |
|
|---|
| Try MShigh |
|
|---|
| ChTry MShigh |
|
|---|
| ArgC MShigh |
|
|---|
| LysN MShigh |
|
|---|
| TryLysC MShigh |
|
|---|
General Statistics
Number of major isoforms |
Number of additional isoforms |
Number of all proteins |
Number of amino acids |
Min. Seq. Length |
Max. Seq. Length |
Avg. Seq. Length |
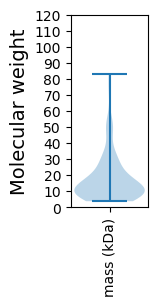
Avg. Mol. Weight |
|---|---|---|---|---|---|---|---|
0 |
13983 |
32 |
776 |
158.9 |
17.91 |
Amino acid frequency
Ala |
Cys |
Asp |
Glu |
Phe |
Gly |
His |
Ile |
Lys |
Leu |
|---|---|---|---|---|---|---|---|---|---|
7.223 ± 0.338 | 1.223 ± 0.127 |
6.05 ± 0.249 | 6.708 ± 0.404 |
4.491 ± 0.233 | 6.851 ± 0.283 |
1.666 ± 0.141 | 7.23 ± 0.223 |
7.638 ± 0.33 | 8.017 ± 0.273 |
Met |
Asn |
Gln |
Pro |
Arg |
Ser |
Thr |
Val |
Trp |
Tyr |
|---|---|---|---|---|---|---|---|---|---|
2.853 ± 0.168 | 5.993 ± 0.294 |
2.904 ± 0.146 | 3.826 ± 0.258 |
3.876 ± 0.185 | 6.301 ± 0.201 |
5.364 ± 0.364 | 6.436 ± 0.268 |
1.416 ± 0.1 | 3.933 ± 0.187 |
Most of the basic statistics you can see at this page can be downloaded from this CSV file
See this proteome in:

Proteome-pI is available under Creative Commons Attribution-NoDerivs license, for more details see here
| Reference: Kozlowski LP. Proteome-pI 2.0: Proteome Isoelectric Point Database Update. Nucleic Acids Res. 2021, doi: 10.1093/nar/gkab944 | Contact: Lukasz P. Kozlowski |