Mycobacterium phage Kimona
Taxonomy: Viruses; Duplodnaviria; Heunggongvirae; Uroviricota; Caudoviricetes; Caudovirales; Siphoviridae; Fromanvirus; unclassified Fromanvirus
Average proteome isoelectric point is 6.49
Get precalculated fractions of proteins
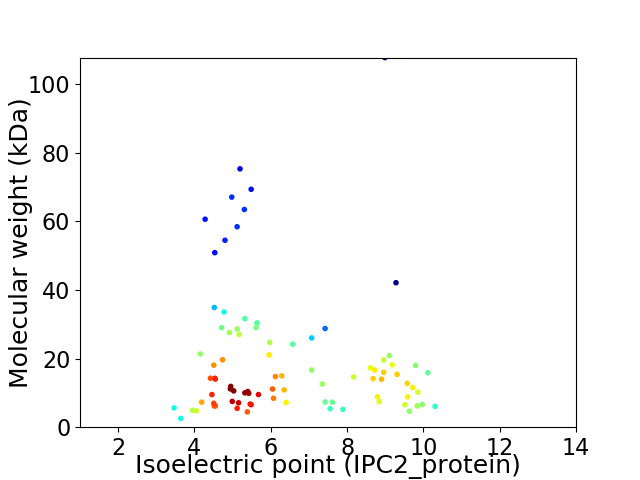
Virtual 2D-PAGE plot for 87 proteins (isoelectric point calculated using IPC2_protein)
Get csv file with sequences according to given criteria:
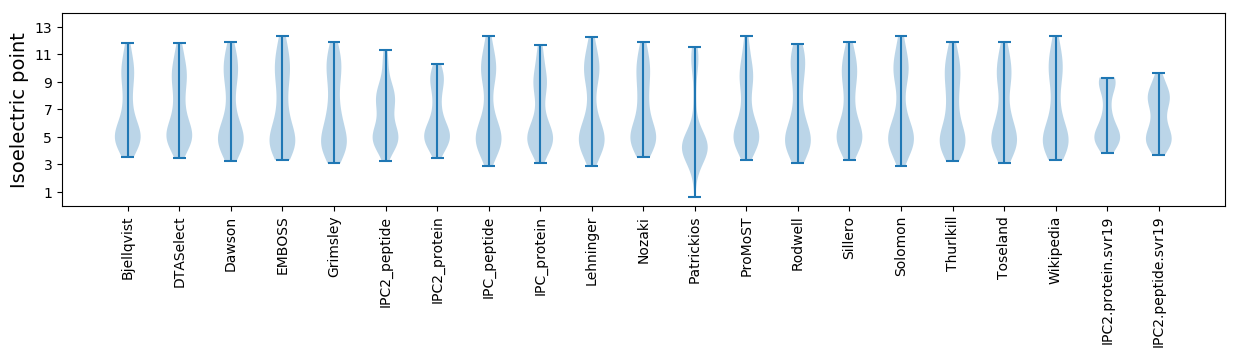
* You can choose from 21 different methods for calculating isoelectric point
Summary statistics related to proteome-wise predictions
Protein with the lowest isoelectric point:
>tr|A0A249XU38|A0A249XU38_9CAUD Uncharacterized protein OS=Mycobacterium phage Kimona OX=2024295 GN=77 PE=4 SV=1
MM1 pKa = 7.76PEE3 pKa = 4.64GYY5 pKa = 8.47TEE7 pKa = 4.68AEE9 pKa = 3.79WLGFKK14 pKa = 10.32PGAPTLPYY22 pKa = 10.0RR23 pKa = 11.84EE24 pKa = 4.3EE25 pKa = 4.26PDD27 pKa = 3.11YY28 pKa = 11.6SLIHH32 pKa = 6.87DD33 pKa = 4.47YY34 pKa = 10.97VWEE37 pKa = 4.72GDD39 pKa = 3.62ADD41 pKa = 4.09GEE43 pKa = 4.38
MM1 pKa = 7.76PEE3 pKa = 4.64GYY5 pKa = 8.47TEE7 pKa = 4.68AEE9 pKa = 3.79WLGFKK14 pKa = 10.32PGAPTLPYY22 pKa = 10.0RR23 pKa = 11.84EE24 pKa = 4.3EE25 pKa = 4.26PDD27 pKa = 3.11YY28 pKa = 11.6SLIHH32 pKa = 6.87DD33 pKa = 4.47YY34 pKa = 10.97VWEE37 pKa = 4.72GDD39 pKa = 3.62ADD41 pKa = 4.09GEE43 pKa = 4.38
Molecular weight: 4.93 kDa
Isoelectric point according different methods:
Protein with the highest isoelectric point:
>tr|A0A249XU23|A0A249XU23_9CAUD Uncharacterized protein OS=Mycobacterium phage Kimona OX=2024295 GN=35 PE=4 SV=1
MM1 pKa = 7.81LSIQQTADD9 pKa = 3.07HH10 pKa = 6.78LGVSTKK16 pKa = 7.21TVRR19 pKa = 11.84RR20 pKa = 11.84YY21 pKa = 9.82IADD24 pKa = 3.35GRR26 pKa = 11.84IKK28 pKa = 10.45AVRR31 pKa = 11.84LGPRR35 pKa = 11.84LIRR38 pKa = 11.84VDD40 pKa = 3.36RR41 pKa = 11.84SSVEE45 pKa = 3.63EE46 pKa = 3.82LMRR49 pKa = 11.84PIGNYY54 pKa = 9.53AA55 pKa = 3.13
MM1 pKa = 7.81LSIQQTADD9 pKa = 3.07HH10 pKa = 6.78LGVSTKK16 pKa = 7.21TVRR19 pKa = 11.84RR20 pKa = 11.84YY21 pKa = 9.82IADD24 pKa = 3.35GRR26 pKa = 11.84IKK28 pKa = 10.45AVRR31 pKa = 11.84LGPRR35 pKa = 11.84LIRR38 pKa = 11.84VDD40 pKa = 3.36RR41 pKa = 11.84SSVEE45 pKa = 3.63EE46 pKa = 3.82LMRR49 pKa = 11.84PIGNYY54 pKa = 9.53AA55 pKa = 3.13
Molecular weight: 6.21 kDa
Isoelectric point according different methods:
Peptides (in silico digests for buttom-up proteomics)
Below you can find in silico digests of the whole proteome with Trypsin, Chymotrypsin, Trypsin+LysC, LysN, ArgC proteases suitable for different mass spec machines.| Try ESI |
 |
|---|
| ChTry ESI |
|
|---|
| ArgC ESI |
|
|---|
| LysN ESI |
|
|---|
| TryLysC ESI |
|
|---|
| Try MALDI |
|
|---|
| ChTry MALDI |
|
|---|
| ArgC MALDI |
|
|---|
| LysN MALDI |
|
|---|
| TryLysC MALDI |
|
|---|
| Try LTQ |
|
|---|
| ChTry LTQ |
|
|---|
| ArgC LTQ |
|
|---|
| LysN LTQ |
|
|---|
| TryLysC LTQ |
|
|---|
| Try MSlow |
|
|---|
| ChTry MSlow |
|
|---|
| ArgC MSlow |
|
|---|
| LysN MSlow |
|
|---|
| TryLysC MSlow |
|
|---|
| Try MShigh |
|
|---|
| ChTry MShigh |
|
|---|
| ArgC MShigh |
|
|---|
| LysN MShigh |
|
|---|
| TryLysC MShigh |
|
|---|
General Statistics
Number of major isoforms |
Number of additional isoforms |
Number of all proteins |
Number of amino acids |
Min. Seq. Length |
Max. Seq. Length |
Avg. Seq. Length |
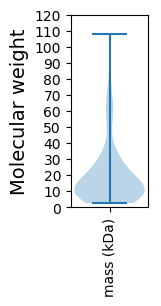
Avg. Mol. Weight |
|---|---|---|---|---|---|---|---|
0 |
15512 |
23 |
1011 |
178.3 |
19.82 |
Amino acid frequency
Ala |
Cys |
Asp |
Glu |
Phe |
Gly |
His |
Ile |
Lys |
Leu |
|---|---|---|---|---|---|---|---|---|---|
10.128 ± 0.446 | 0.845 ± 0.132 |
6.215 ± 0.273 | 6.924 ± 0.396 |
3.262 ± 0.256 | 8.297 ± 0.372 |
2.256 ± 0.223 | 4.558 ± 0.145 |
4.422 ± 0.195 | 8.297 ± 0.31 |
Met |
Asn |
Gln |
Pro |
Arg |
Ser |
Thr |
Val |
Trp |
Tyr |
|---|---|---|---|---|---|---|---|---|---|
2.501 ± 0.138 | 3.236 ± 0.183 |
5.299 ± 0.286 | 3.823 ± 0.341 |
7.265 ± 0.454 | 4.874 ± 0.215 |
5.628 ± 0.262 | 7.156 ± 0.201 |
2.044 ± 0.145 | 2.972 ± 0.223 |
Most of the basic statistics you can see at this page can be downloaded from this CSV file
See this proteome in:

Proteome-pI is available under Creative Commons Attribution-NoDerivs license, for more details see here
| Reference: Kozlowski LP. Proteome-pI 2.0: Proteome Isoelectric Point Database Update. Nucleic Acids Res. 2021, doi: 10.1093/nar/gkab944 | Contact: Lukasz P. Kozlowski |