Pseudomonas bauzanensis
Taxonomy: cellular organisms; Bacteria; Proteobacteria; Gammaproteobacteria; Pseudomonadales; Pseudomonadaceae; Pseudomonas
Average proteome isoelectric point is 6.07
Get precalculated fractions of proteins
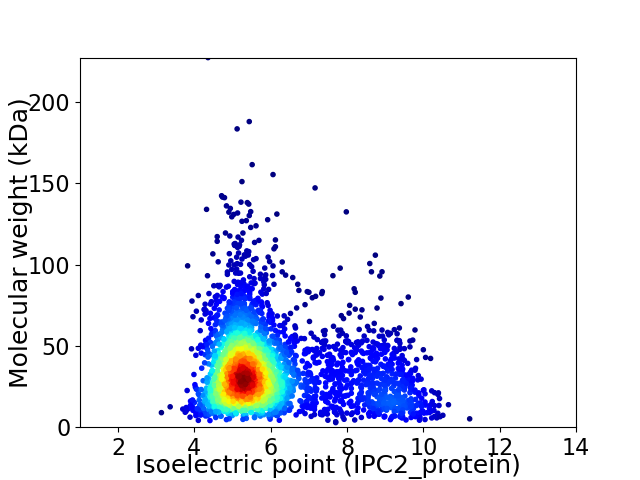
Virtual 2D-PAGE plot for 3223 proteins (isoelectric point calculated using IPC2_protein)
Get csv file with sequences according to given criteria:
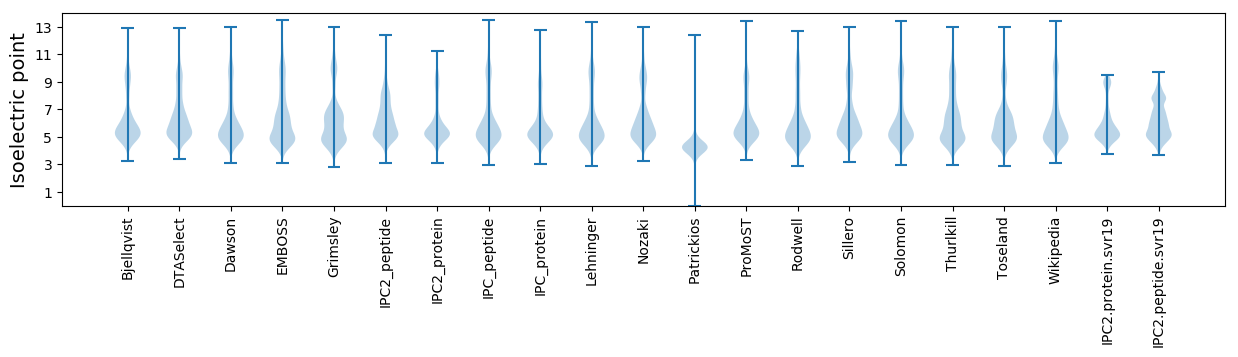
* You can choose from 21 different methods for calculating isoelectric point
Summary statistics related to proteome-wise predictions
Protein with the lowest isoelectric point:
>tr|A0A031ME59|A0A031ME59_9PSED Uncharacterized protein OS=Pseudomonas bauzanensis OX=653930 GN=SAMN04487855_1747 PE=4 SV=1
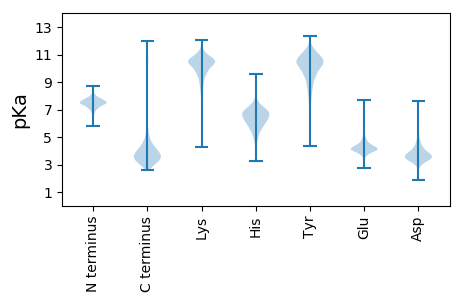
MM1 pKa = 7.56KK2 pKa = 10.04KK3 pKa = 8.44WQCIVCGFIYY13 pKa = 10.49DD14 pKa = 4.14EE15 pKa = 4.74AEE17 pKa = 3.72GWPDD21 pKa = 4.01DD22 pKa = 4.65GIAPGTRR29 pKa = 11.84WEE31 pKa = 4.84DD32 pKa = 3.65VPADD36 pKa = 3.99WQCPDD41 pKa = 3.85CGVGKK46 pKa = 10.53EE47 pKa = 4.19DD48 pKa = 4.87FEE50 pKa = 4.83MIAIGG55 pKa = 4.11
MM1 pKa = 7.56KK2 pKa = 10.04KK3 pKa = 8.44WQCIVCGFIYY13 pKa = 10.49DD14 pKa = 4.14EE15 pKa = 4.74AEE17 pKa = 3.72GWPDD21 pKa = 4.01DD22 pKa = 4.65GIAPGTRR29 pKa = 11.84WEE31 pKa = 4.84DD32 pKa = 3.65VPADD36 pKa = 3.99WQCPDD41 pKa = 3.85CGVGKK46 pKa = 10.53EE47 pKa = 4.19DD48 pKa = 4.87FEE50 pKa = 4.83MIAIGG55 pKa = 4.11
Molecular weight: 6.18 kDa
Isoelectric point according different methods:
Protein with the highest isoelectric point:
>tr|A0A1I4LRW3|A0A1I4LRW3_9PSED Ribonuclease P protein component OS=Pseudomonas bauzanensis OX=653930 GN=rnpA PE=3 SV=1
MM1 pKa = 7.45KK2 pKa = 9.51RR3 pKa = 11.84TFQPSVLKK11 pKa = 10.46RR12 pKa = 11.84KK13 pKa = 9.37RR14 pKa = 11.84NHH16 pKa = 5.37GFRR19 pKa = 11.84ARR21 pKa = 11.84MATKK25 pKa = 10.3NGRR28 pKa = 11.84AVLARR33 pKa = 11.84RR34 pKa = 11.84RR35 pKa = 11.84AKK37 pKa = 10.29GRR39 pKa = 11.84HH40 pKa = 5.49KK41 pKa = 10.9LSAA44 pKa = 3.8
MM1 pKa = 7.45KK2 pKa = 9.51RR3 pKa = 11.84TFQPSVLKK11 pKa = 10.46RR12 pKa = 11.84KK13 pKa = 9.37RR14 pKa = 11.84NHH16 pKa = 5.37GFRR19 pKa = 11.84ARR21 pKa = 11.84MATKK25 pKa = 10.3NGRR28 pKa = 11.84AVLARR33 pKa = 11.84RR34 pKa = 11.84RR35 pKa = 11.84AKK37 pKa = 10.29GRR39 pKa = 11.84HH40 pKa = 5.49KK41 pKa = 10.9LSAA44 pKa = 3.8
Molecular weight: 5.15 kDa
Isoelectric point according different methods:
Peptides (in silico digests for buttom-up proteomics)
Below you can find in silico digests of the whole proteome with Trypsin, Chymotrypsin, Trypsin+LysC, LysN, ArgC proteases suitable for different mass spec machines.| Try ESI |
 |
|---|
| ChTry ESI |
|
|---|
| ArgC ESI |
|
|---|
| LysN ESI |
|
|---|
| TryLysC ESI |
|
|---|
| Try MALDI |
|
|---|
| ChTry MALDI |
|
|---|
| ArgC MALDI |
|
|---|
| LysN MALDI |
|
|---|
| TryLysC MALDI |
|
|---|
| Try LTQ |
|
|---|
| ChTry LTQ |
|
|---|
| ArgC LTQ |
|
|---|
| LysN LTQ |
|
|---|
| TryLysC LTQ |
|
|---|
| Try MSlow |
|
|---|
| ChTry MSlow |
|
|---|
| ArgC MSlow |
|
|---|
| LysN MSlow |
|
|---|
| TryLysC MSlow |
|
|---|
| Try MShigh |
|
|---|
| ChTry MShigh |
|
|---|
| ArgC MShigh |
|
|---|
| LysN MShigh |
|
|---|
| TryLysC MShigh |
|
|---|
General Statistics
Number of major isoforms |
Number of additional isoforms |
Number of all proteins |
Number of amino acids |
Min. Seq. Length |
Max. Seq. Length |
Avg. Seq. Length |
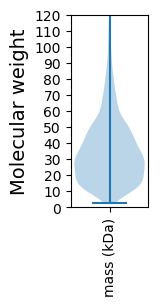
Avg. Mol. Weight |
|---|---|---|---|---|---|---|---|
0 |
1068713 |
23 |
2081 |
331.6 |
36.47 |
Amino acid frequency
Ala |
Cys |
Asp |
Glu |
Phe |
Gly |
His |
Ile |
Lys |
Leu |
|---|---|---|---|---|---|---|---|---|---|
10.658 ± 0.046 | 0.995 ± 0.015 |
5.594 ± 0.036 | 6.034 ± 0.036 |
3.542 ± 0.03 | 7.931 ± 0.04 |
2.31 ± 0.019 | 5.078 ± 0.033 |
2.951 ± 0.032 | 11.633 ± 0.058 |
Met |
Asn |
Gln |
Pro |
Arg |
Ser |
Thr |
Val |
Trp |
Tyr |
|---|---|---|---|---|---|---|---|---|---|
2.557 ± 0.017 | 3.018 ± 0.025 |
4.878 ± 0.026 | 4.693 ± 0.036 |
6.687 ± 0.037 | 5.609 ± 0.028 |
4.925 ± 0.024 | 6.99 ± 0.033 |
1.436 ± 0.018 | 2.482 ± 0.025 |
Most of the basic statistics you can see at this page can be downloaded from this CSV file
See this proteome in:

Proteome-pI is available under Creative Commons Attribution-NoDerivs license, for more details see here
| Reference: Kozlowski LP. Proteome-pI 2.0: Proteome Isoelectric Point Database Update. Nucleic Acids Res. 2021, doi: 10.1093/nar/gkab944 | Contact: Lukasz P. Kozlowski |