Klebsiella phage ST13-OXA48phi12.1
Taxonomy: Viruses; Duplodnaviria; Heunggongvirae; Uroviricota; Caudoviricetes; Caudovirales; Myoviridae; Peduovirinae; Felsduovirus; Klebsiella virus ST13OXA48phi12-1
Average proteome isoelectric point is 6.43
Get precalculated fractions of proteins
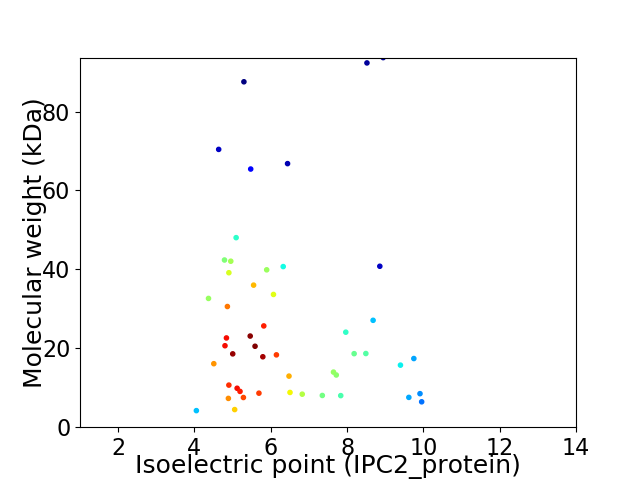
Virtual 2D-PAGE plot for 50 proteins (isoelectric point calculated using IPC2_protein)
Get csv file with sequences according to given criteria:
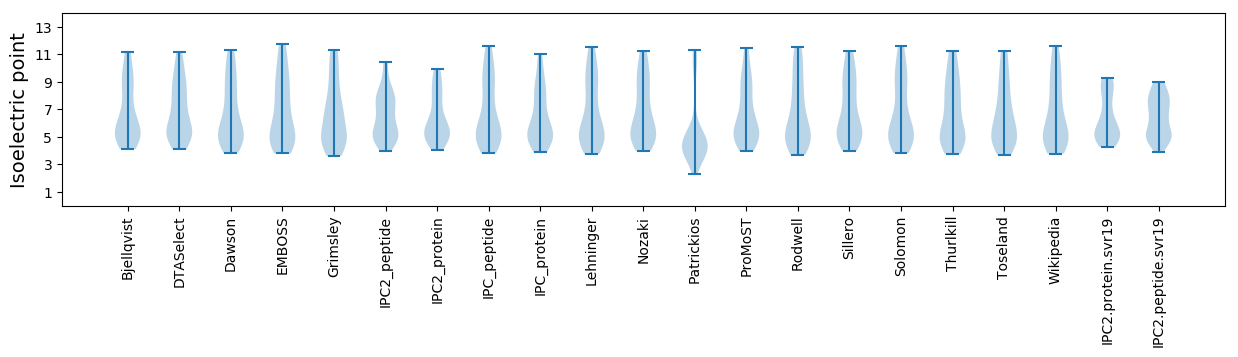
* You can choose from 21 different methods for calculating isoelectric point
Summary statistics related to proteome-wise predictions
Protein with the lowest isoelectric point:
>tr|A0A482J789|A0A482J789_9CAUD Portal protein OS=Klebsiella phage ST13-OXA48phi12.1 OX=2510464 PE=3 SV=1
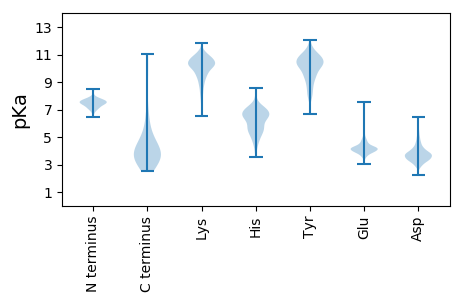
MM1 pKa = 7.78LDD3 pKa = 3.17EE4 pKa = 5.33TEE6 pKa = 4.52AAWAACADD14 pKa = 3.83KK15 pKa = 11.02VDD17 pKa = 4.66TIIACQEE24 pKa = 3.92RR25 pKa = 11.84DD26 pKa = 3.52SEE28 pKa = 4.35QATVLTQRR36 pKa = 11.84SEE38 pKa = 3.79
MM1 pKa = 7.78LDD3 pKa = 3.17EE4 pKa = 5.33TEE6 pKa = 4.52AAWAACADD14 pKa = 3.83KK15 pKa = 11.02VDD17 pKa = 4.66TIIACQEE24 pKa = 3.92RR25 pKa = 11.84DD26 pKa = 3.52SEE28 pKa = 4.35QATVLTQRR36 pKa = 11.84SEE38 pKa = 3.79
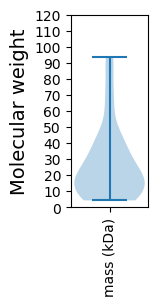
Molecular weight: 4.2 kDa
Isoelectric point according different methods:
Protein with the highest isoelectric point:
>tr|A0A482J5E7|A0A482J5E7_9CAUD Regulatory protein CII OS=Klebsiella phage ST13-OXA48phi12.1 OX=2510464 PE=4 SV=1
MM1 pKa = 7.37NLHH4 pKa = 6.52DD5 pKa = 4.55RR6 pKa = 11.84LRR8 pKa = 11.84IVLAPARR15 pKa = 11.84QFWRR19 pKa = 11.84AFSYY23 pKa = 10.73LMQVHH28 pKa = 6.43EE29 pKa = 3.96NHH31 pKa = 4.89YY32 pKa = 8.78TKK34 pKa = 10.66RR35 pKa = 11.84AGVAGIRR42 pKa = 11.84ARR44 pKa = 11.84VQGAKK49 pKa = 10.05LAEE52 pKa = 4.43SKK54 pKa = 11.25GDD56 pKa = 3.41
MM1 pKa = 7.37NLHH4 pKa = 6.52DD5 pKa = 4.55RR6 pKa = 11.84LRR8 pKa = 11.84IVLAPARR15 pKa = 11.84QFWRR19 pKa = 11.84AFSYY23 pKa = 10.73LMQVHH28 pKa = 6.43EE29 pKa = 3.96NHH31 pKa = 4.89YY32 pKa = 8.78TKK34 pKa = 10.66RR35 pKa = 11.84AGVAGIRR42 pKa = 11.84ARR44 pKa = 11.84VQGAKK49 pKa = 10.05LAEE52 pKa = 4.43SKK54 pKa = 11.25GDD56 pKa = 3.41
Molecular weight: 6.44 kDa
Isoelectric point according different methods:
Peptides (in silico digests for buttom-up proteomics)
Below you can find in silico digests of the whole proteome with Trypsin, Chymotrypsin, Trypsin+LysC, LysN, ArgC proteases suitable for different mass spec machines.| Try ESI |
 |
|---|
| ChTry ESI |
|
|---|
| ArgC ESI |
|
|---|
| LysN ESI |
|
|---|
| TryLysC ESI |
|
|---|
| Try MALDI |
|
|---|
| ChTry MALDI |
|
|---|
| ArgC MALDI |
|
|---|
| LysN MALDI |
|
|---|
| TryLysC MALDI |
|
|---|
| Try LTQ |
|
|---|
| ChTry LTQ |
|
|---|
| ArgC LTQ |
|
|---|
| LysN LTQ |
|
|---|
| TryLysC LTQ |
|
|---|
| Try MSlow |
|
|---|
| ChTry MSlow |
|
|---|
| ArgC MSlow |
|
|---|
| LysN MSlow |
|
|---|
| TryLysC MSlow |
|
|---|
| Try MShigh |
|
|---|
| ChTry MShigh |
|
|---|
| ArgC MShigh |
|
|---|
| LysN MShigh |
|
|---|
| TryLysC MShigh |
|
|---|
General Statistics
Number of major isoforms |
Number of additional isoforms |
Number of all proteins |
Number of amino acids |
Min. Seq. Length |
Max. Seq. Length |
Avg. Seq. Length |
Avg. Mol. Weight |
|---|---|---|---|---|---|---|---|
0 |
12239 |
38 |
875 |
244.8 |
27.29 |
Amino acid frequency
Ala |
Cys |
Asp |
Glu |
Phe |
Gly |
His |
Ile |
Lys |
Leu |
|---|---|---|---|---|---|---|---|---|---|
9.715 ± 0.438 | 1.013 ± 0.139 |
6.12 ± 0.236 | 6.496 ± 0.386 |
3.513 ± 0.228 | 6.912 ± 0.378 |
1.699 ± 0.197 | 5.197 ± 0.229 |
5.147 ± 0.288 | 9.372 ± 0.314 |
Met |
Asn |
Gln |
Pro |
Arg |
Ser |
Thr |
Val |
Trp |
Tyr |
|---|---|---|---|---|---|---|---|---|---|
2.868 ± 0.195 | 4.314 ± 0.201 |
4.11 ± 0.181 | 4.428 ± 0.196 |
6.749 ± 0.396 | 5.932 ± 0.209 |
5.916 ± 0.328 | 6.251 ± 0.28 |
1.471 ± 0.133 | 2.778 ± 0.2 |
Most of the basic statistics you can see at this page can be downloaded from this CSV file
See this proteome in:

Proteome-pI is available under Creative Commons Attribution-NoDerivs license, for more details see here
| Reference: Kozlowski LP. Proteome-pI 2.0: Proteome Isoelectric Point Database Update. Nucleic Acids Res. 2021, doi: 10.1093/nar/gkab944 | Contact: Lukasz P. Kozlowski |