Leucobacter luti
Taxonomy: cellular organisms; Bacteria; Terrabacteria group; Actinobacteria; Actinomycetia; Micrococcales; Microbacteriaceae; Leucobacter
Average proteome isoelectric point is 6.07
Get precalculated fractions of proteins
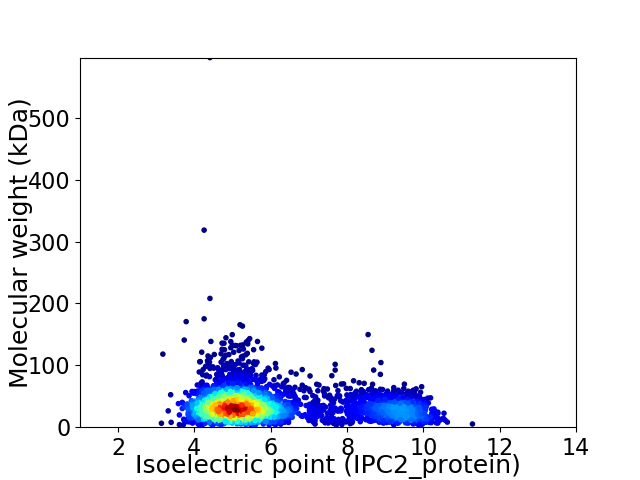
Virtual 2D-PAGE plot for 3417 proteins (isoelectric point calculated using IPC2_protein)
Get csv file with sequences according to given criteria:
* You can choose from 21 different methods for calculating isoelectric point
Summary statistics related to proteome-wise predictions
Protein with the lowest isoelectric point:
>tr|A0A4V3CYA9|A0A4V3CYA9_9MICO NADPH2:quinone reductase OS=Leucobacter luti OX=340320 GN=EDF62_1347 PE=4 SV=1
MM1 pKa = 7.31NRR3 pKa = 11.84LTRR6 pKa = 11.84TLSITAASLLALTLAACTGSPRR28 pKa = 11.84PEE30 pKa = 4.35DD31 pKa = 3.73ATAHH35 pKa = 6.11GADD38 pKa = 4.58GYY40 pKa = 9.72PVTVTSCGTDD50 pKa = 3.34YY51 pKa = 10.96TYY53 pKa = 11.64DD54 pKa = 3.6RR55 pKa = 11.84APEE58 pKa = 3.99RR59 pKa = 11.84VLLGAPGIVRR69 pKa = 11.84TLDD72 pKa = 3.33EE73 pKa = 5.25LGVADD78 pKa = 4.18SAIGYY83 pKa = 6.32TLSDD87 pKa = 3.9YY88 pKa = 11.16AVEE91 pKa = 4.71GLDD94 pKa = 3.51EE95 pKa = 4.74FPNLTVTSADD105 pKa = 3.5YY106 pKa = 9.79TPSRR110 pKa = 11.84EE111 pKa = 4.11FLISAQPDD119 pKa = 3.65LFLSNDD125 pKa = 3.42EE126 pKa = 4.1QQLLGDD132 pKa = 4.52GAASVDD138 pKa = 3.87DD139 pKa = 5.03LGAIPANLYY148 pKa = 10.53VLGDD152 pKa = 3.83YY153 pKa = 11.0CVDD156 pKa = 3.79APAQSTLDD164 pKa = 3.44VVYY167 pKa = 10.94DD168 pKa = 4.54DD169 pKa = 5.15IEE171 pKa = 4.47HH172 pKa = 6.97LGAIYY177 pKa = 10.01NVPDD181 pKa = 3.48SAASLVEE188 pKa = 3.87EE189 pKa = 4.42LKK191 pKa = 11.16ARR193 pKa = 11.84VTAATAPLSFEE204 pKa = 4.64ADD206 pKa = 3.71FTAGAVTIFDD216 pKa = 3.76GKK218 pKa = 10.88VYY220 pKa = 10.84ALGGSYY226 pKa = 10.11YY227 pKa = 10.95AAILHH232 pKa = 6.61ALGLTNGFADD242 pKa = 5.26LDD244 pKa = 4.78SNWSEE249 pKa = 3.86ITPEE253 pKa = 3.78AVLASDD259 pKa = 4.78LDD261 pKa = 4.48VILVTAPEE269 pKa = 4.39GDD271 pKa = 3.02ATGAVEE277 pKa = 4.13TASEE281 pKa = 4.26LFANAPAAQHH291 pKa = 5.3GRR293 pKa = 11.84IVAIDD298 pKa = 3.45DD299 pKa = 3.6TAFQSVGVAIVDD311 pKa = 4.35VIEE314 pKa = 4.0EE315 pKa = 4.11TAAQLAVRR323 pKa = 4.77
MM1 pKa = 7.31NRR3 pKa = 11.84LTRR6 pKa = 11.84TLSITAASLLALTLAACTGSPRR28 pKa = 11.84PEE30 pKa = 4.35DD31 pKa = 3.73ATAHH35 pKa = 6.11GADD38 pKa = 4.58GYY40 pKa = 9.72PVTVTSCGTDD50 pKa = 3.34YY51 pKa = 10.96TYY53 pKa = 11.64DD54 pKa = 3.6RR55 pKa = 11.84APEE58 pKa = 3.99RR59 pKa = 11.84VLLGAPGIVRR69 pKa = 11.84TLDD72 pKa = 3.33EE73 pKa = 5.25LGVADD78 pKa = 4.18SAIGYY83 pKa = 6.32TLSDD87 pKa = 3.9YY88 pKa = 11.16AVEE91 pKa = 4.71GLDD94 pKa = 3.51EE95 pKa = 4.74FPNLTVTSADD105 pKa = 3.5YY106 pKa = 9.79TPSRR110 pKa = 11.84EE111 pKa = 4.11FLISAQPDD119 pKa = 3.65LFLSNDD125 pKa = 3.42EE126 pKa = 4.1QQLLGDD132 pKa = 4.52GAASVDD138 pKa = 3.87DD139 pKa = 5.03LGAIPANLYY148 pKa = 10.53VLGDD152 pKa = 3.83YY153 pKa = 11.0CVDD156 pKa = 3.79APAQSTLDD164 pKa = 3.44VVYY167 pKa = 10.94DD168 pKa = 4.54DD169 pKa = 5.15IEE171 pKa = 4.47HH172 pKa = 6.97LGAIYY177 pKa = 10.01NVPDD181 pKa = 3.48SAASLVEE188 pKa = 3.87EE189 pKa = 4.42LKK191 pKa = 11.16ARR193 pKa = 11.84VTAATAPLSFEE204 pKa = 4.64ADD206 pKa = 3.71FTAGAVTIFDD216 pKa = 3.76GKK218 pKa = 10.88VYY220 pKa = 10.84ALGGSYY226 pKa = 10.11YY227 pKa = 10.95AAILHH232 pKa = 6.61ALGLTNGFADD242 pKa = 5.26LDD244 pKa = 4.78SNWSEE249 pKa = 3.86ITPEE253 pKa = 3.78AVLASDD259 pKa = 4.78LDD261 pKa = 4.48VILVTAPEE269 pKa = 4.39GDD271 pKa = 3.02ATGAVEE277 pKa = 4.13TASEE281 pKa = 4.26LFANAPAAQHH291 pKa = 5.3GRR293 pKa = 11.84IVAIDD298 pKa = 3.45DD299 pKa = 3.6TAFQSVGVAIVDD311 pKa = 4.35VIEE314 pKa = 4.0EE315 pKa = 4.11TAAQLAVRR323 pKa = 4.77
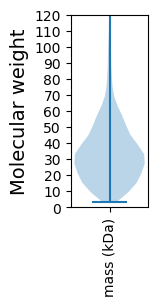
Molecular weight: 33.57 kDa
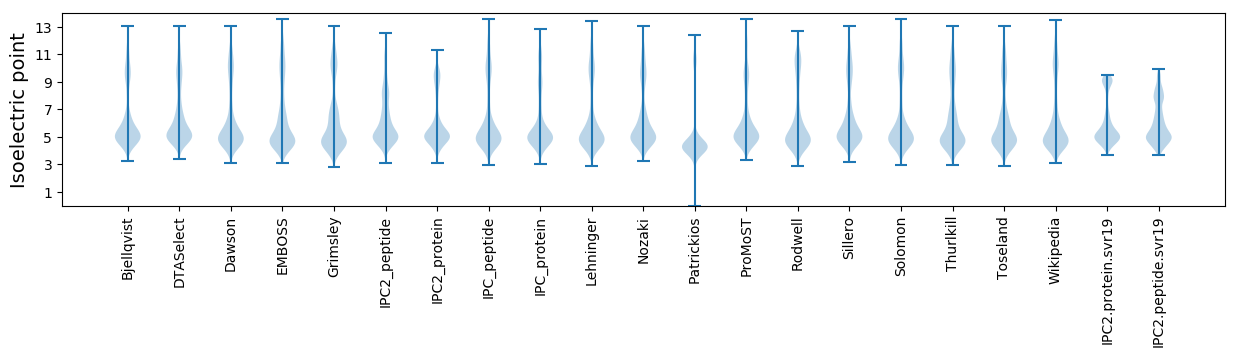
Isoelectric point according different methods:
Protein with the highest isoelectric point:
>tr|A0A4R6S1X5|A0A4R6S1X5_9MICO Phosphatidylglycerol--prolipoprotein diacylglyceryl transferase OS=Leucobacter luti OX=340320 GN=lgt PE=3 SV=1
MM1 pKa = 7.69SKK3 pKa = 9.0RR4 pKa = 11.84TFQPNNRR11 pKa = 11.84RR12 pKa = 11.84RR13 pKa = 11.84AKK15 pKa = 9.5VHH17 pKa = 5.46GFRR20 pKa = 11.84ARR22 pKa = 11.84MRR24 pKa = 11.84TRR26 pKa = 11.84AGRR29 pKa = 11.84AIVAARR35 pKa = 11.84RR36 pKa = 11.84GKK38 pKa = 10.45GRR40 pKa = 11.84SKK42 pKa = 10.13LTAA45 pKa = 4.04
MM1 pKa = 7.69SKK3 pKa = 9.0RR4 pKa = 11.84TFQPNNRR11 pKa = 11.84RR12 pKa = 11.84RR13 pKa = 11.84AKK15 pKa = 9.5VHH17 pKa = 5.46GFRR20 pKa = 11.84ARR22 pKa = 11.84MRR24 pKa = 11.84TRR26 pKa = 11.84AGRR29 pKa = 11.84AIVAARR35 pKa = 11.84RR36 pKa = 11.84GKK38 pKa = 10.45GRR40 pKa = 11.84SKK42 pKa = 10.13LTAA45 pKa = 4.04
Molecular weight: 5.18 kDa
Isoelectric point according different methods:
Peptides (in silico digests for buttom-up proteomics)
Below you can find in silico digests of the whole proteome with Trypsin, Chymotrypsin, Trypsin+LysC, LysN, ArgC proteases suitable for different mass spec machines.| Try ESI |
 |
|---|
| ChTry ESI |
|
|---|
| ArgC ESI |
|
|---|
| LysN ESI |
|
|---|
| TryLysC ESI |
|
|---|
| Try MALDI |
|
|---|
| ChTry MALDI |
|
|---|
| ArgC MALDI |
|
|---|
| LysN MALDI |
|
|---|
| TryLysC MALDI |
|
|---|
| Try LTQ |
|
|---|
| ChTry LTQ |
|
|---|
| ArgC LTQ |
|
|---|
| LysN LTQ |
|
|---|
| TryLysC LTQ |
|
|---|
| Try MSlow |
|
|---|
| ChTry MSlow |
|
|---|
| ArgC MSlow |
|
|---|
| LysN MSlow |
|
|---|
| TryLysC MSlow |
|
|---|
| Try MShigh |
|
|---|
| ChTry MShigh |
|
|---|
| ArgC MShigh |
|
|---|
| LysN MShigh |
|
|---|
| TryLysC MShigh |
|
|---|
General Statistics
Number of major isoforms |
Number of additional isoforms |
Number of all proteins |
Number of amino acids |
Min. Seq. Length |
Max. Seq. Length |
Avg. Seq. Length |
Avg. Mol. Weight |
|---|---|---|---|---|---|---|---|
0 |
1145008 |
29 |
5524 |
335.1 |
35.79 |
Amino acid frequency
Ala |
Cys |
Asp |
Glu |
Phe |
Gly |
His |
Ile |
Lys |
Leu |
|---|---|---|---|---|---|---|---|---|---|
13.516 ± 0.058 | 0.555 ± 0.011 |
5.518 ± 0.037 | 6.007 ± 0.036 |
3.162 ± 0.023 | 8.933 ± 0.036 |
2.021 ± 0.019 | 4.759 ± 0.033 |
2.022 ± 0.028 | 10.191 ± 0.054 |
Met |
Asn |
Gln |
Pro |
Arg |
Ser |
Thr |
Val |
Trp |
Tyr |
|---|---|---|---|---|---|---|---|---|---|
1.807 ± 0.019 | 2.128 ± 0.024 |
5.439 ± 0.029 | 3.127 ± 0.023 |
6.945 ± 0.051 | 5.994 ± 0.03 |
6.295 ± 0.045 | 8.272 ± 0.035 |
1.412 ± 0.016 | 1.896 ± 0.018 |
Most of the basic statistics you can see at this page can be downloaded from this CSV file
See this proteome in:

Proteome-pI is available under Creative Commons Attribution-NoDerivs license, for more details see here
| Reference: Kozlowski LP. Proteome-pI 2.0: Proteome Isoelectric Point Database Update. Nucleic Acids Res. 2021, doi: 10.1093/nar/gkab944 | Contact: Lukasz P. Kozlowski |