Desulfoglaeba alkanexedens ALDC
Taxonomy: cellular organisms; Bacteria; Proteobacteria; delta/epsilon subdivisions; Deltaproteobacteria; Syntrophobacterales; Syntrophobacteraceae; Desulfoglaeba; Desulfoglaeba alkanexedens
Average proteome isoelectric point is 6.76
Get precalculated fractions of proteins
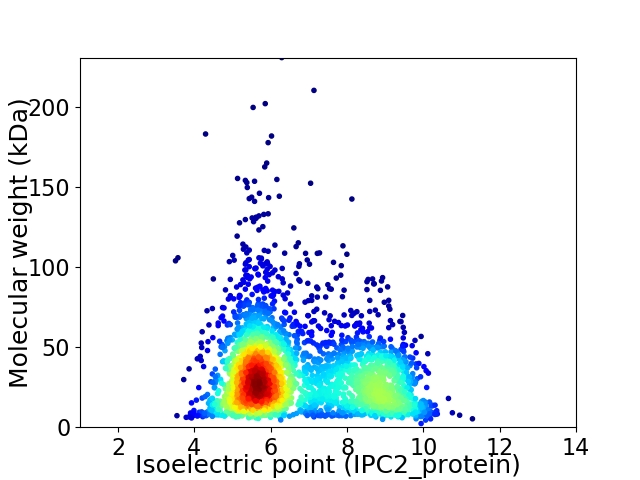
Virtual 2D-PAGE plot for 2850 proteins (isoelectric point calculated using IPC2_protein)
Get csv file with sequences according to given criteria:
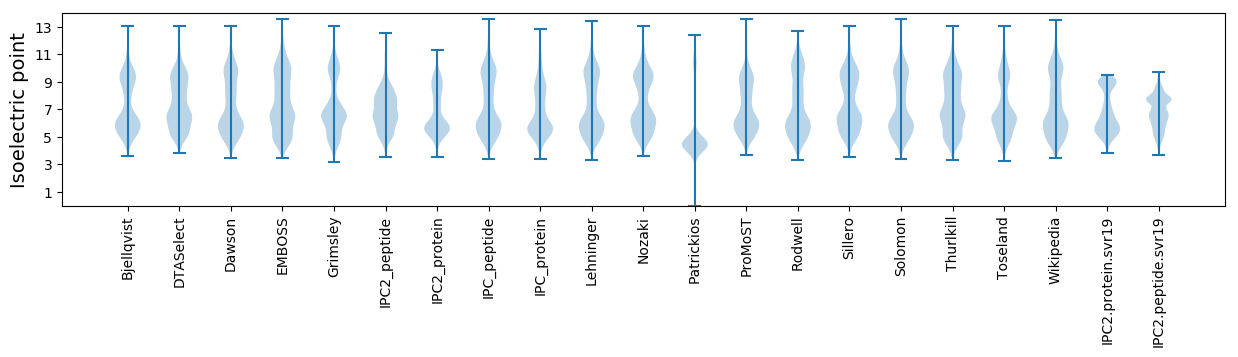
* You can choose from 21 different methods for calculating isoelectric point
Summary statistics related to proteome-wise predictions
Protein with the lowest isoelectric point:
>tr|A0A4P8L1K2|A0A4P8L1K2_9DELT MarR family transcriptional regulator OS=Desulfoglaeba alkanexedens ALDC OX=980445 GN=FDQ92_00270 PE=4 SV=1
MM1 pKa = 7.81DD2 pKa = 5.74RR3 pKa = 11.84YY4 pKa = 10.37VCQICGYY11 pKa = 10.7VYY13 pKa = 10.83DD14 pKa = 5.34PDD16 pKa = 5.05QGDD19 pKa = 4.12PDD21 pKa = 3.91NGIAPGTPFEE31 pKa = 4.86KK32 pKa = 10.92LPDD35 pKa = 3.7DD36 pKa = 3.82WTCPVCGASKK46 pKa = 11.02SEE48 pKa = 4.15FEE50 pKa = 4.7KK51 pKa = 10.98EE52 pKa = 3.79
MM1 pKa = 7.81DD2 pKa = 5.74RR3 pKa = 11.84YY4 pKa = 10.37VCQICGYY11 pKa = 10.7VYY13 pKa = 10.83DD14 pKa = 5.34PDD16 pKa = 5.05QGDD19 pKa = 4.12PDD21 pKa = 3.91NGIAPGTPFEE31 pKa = 4.86KK32 pKa = 10.92LPDD35 pKa = 3.7DD36 pKa = 3.82WTCPVCGASKK46 pKa = 11.02SEE48 pKa = 4.15FEE50 pKa = 4.7KK51 pKa = 10.98EE52 pKa = 3.79
Molecular weight: 5.79 kDa
Isoelectric point according different methods:
Protein with the highest isoelectric point:
>tr|A0A4P8L2D2|A0A4P8L2D2_9DELT ABC_transp_aux domain-containing protein OS=Desulfoglaeba alkanexedens ALDC OX=980445 GN=FDQ92_07635 PE=4 SV=1
MM1 pKa = 7.45KK2 pKa = 9.61RR3 pKa = 11.84TFQPSNLKK11 pKa = 10.2RR12 pKa = 11.84KK13 pKa = 7.55RR14 pKa = 11.84THH16 pKa = 5.91GFLVRR21 pKa = 11.84MATRR25 pKa = 11.84SGRR28 pKa = 11.84AVIRR32 pKa = 11.84RR33 pKa = 11.84RR34 pKa = 11.84RR35 pKa = 11.84AKK37 pKa = 9.59GRR39 pKa = 11.84KK40 pKa = 8.66RR41 pKa = 11.84LAVV44 pKa = 3.41
MM1 pKa = 7.45KK2 pKa = 9.61RR3 pKa = 11.84TFQPSNLKK11 pKa = 10.2RR12 pKa = 11.84KK13 pKa = 7.55RR14 pKa = 11.84THH16 pKa = 5.91GFLVRR21 pKa = 11.84MATRR25 pKa = 11.84SGRR28 pKa = 11.84AVIRR32 pKa = 11.84RR33 pKa = 11.84RR34 pKa = 11.84RR35 pKa = 11.84AKK37 pKa = 9.59GRR39 pKa = 11.84KK40 pKa = 8.66RR41 pKa = 11.84LAVV44 pKa = 3.41
Molecular weight: 5.25 kDa
Isoelectric point according different methods:
Peptides (in silico digests for buttom-up proteomics)
Below you can find in silico digests of the whole proteome with Trypsin, Chymotrypsin, Trypsin+LysC, LysN, ArgC proteases suitable for different mass spec machines.| Try ESI |
 |
|---|
| ChTry ESI |
|
|---|
| ArgC ESI |
|
|---|
| LysN ESI |
|
|---|
| TryLysC ESI |
|
|---|
| Try MALDI |
|
|---|
| ChTry MALDI |
|
|---|
| ArgC MALDI |
|
|---|
| LysN MALDI |
|
|---|
| TryLysC MALDI |
|
|---|
| Try LTQ |
|
|---|
| ChTry LTQ |
|
|---|
| ArgC LTQ |
|
|---|
| LysN LTQ |
|
|---|
| TryLysC LTQ |
|
|---|
| Try MSlow |
|
|---|
| ChTry MSlow |
|
|---|
| ArgC MSlow |
|
|---|
| LysN MSlow |
|
|---|
| TryLysC MSlow |
|
|---|
| Try MShigh |
|
|---|
| ChTry MShigh |
|
|---|
| ArgC MShigh |
|
|---|
| LysN MShigh |
|
|---|
| TryLysC MShigh |
|
|---|
General Statistics
Number of major isoforms |
Number of additional isoforms |
Number of all proteins |
Number of amino acids |
Min. Seq. Length |
Max. Seq. Length |
Avg. Seq. Length |
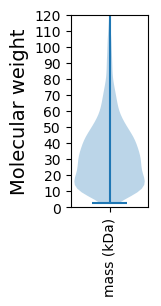
Avg. Mol. Weight |
|---|---|---|---|---|---|---|---|
0 |
914423 |
22 |
2062 |
320.9 |
35.69 |
Amino acid frequency
Ala |
Cys |
Asp |
Glu |
Phe |
Gly |
His |
Ile |
Lys |
Leu |
|---|---|---|---|---|---|---|---|---|---|
9.424 ± 0.053 | 1.298 ± 0.022 |
5.304 ± 0.032 | 7.289 ± 0.046 |
4.047 ± 0.029 | 7.911 ± 0.036 |
2.249 ± 0.018 | 5.216 ± 0.036 |
4.17 ± 0.038 | 10.504 ± 0.05 |
Met |
Asn |
Gln |
Pro |
Arg |
Ser |
Thr |
Val |
Trp |
Tyr |
|---|---|---|---|---|---|---|---|---|---|
2.325 ± 0.019 | 2.567 ± 0.022 |
5.116 ± 0.029 | 3.062 ± 0.029 |
8.013 ± 0.046 | 5.193 ± 0.031 |
4.684 ± 0.028 | 7.771 ± 0.043 |
1.281 ± 0.019 | 2.578 ± 0.025 |
Most of the basic statistics you can see at this page can be downloaded from this CSV file
See this proteome in:

Proteome-pI is available under Creative Commons Attribution-NoDerivs license, for more details see here
| Reference: Kozlowski LP. Proteome-pI 2.0: Proteome Isoelectric Point Database Update. Nucleic Acids Res. 2021, doi: 10.1093/nar/gkab944 | Contact: Lukasz P. Kozlowski |