Streptococcus phage DCC1738
Taxonomy: Viruses; Duplodnaviria; Heunggongvirae; Uroviricota; Caudoviricetes; Caudovirales; Siphoviridae; unclassified Siphoviridae
Average proteome isoelectric point is 6.31
Get precalculated fractions of proteins
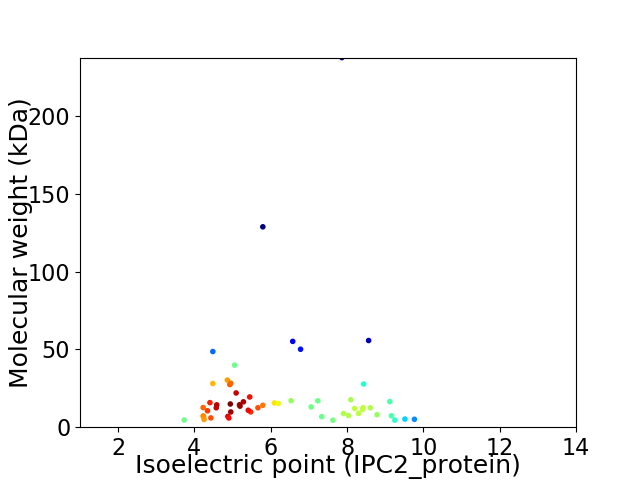
Virtual 2D-PAGE plot for 56 proteins (isoelectric point calculated using IPC2_protein)
Get csv file with sequences according to given criteria:
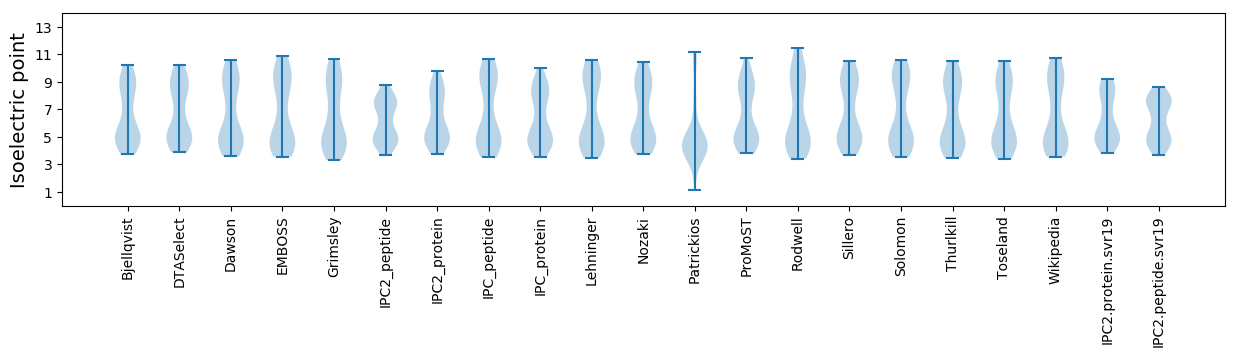
* You can choose from 21 different methods for calculating isoelectric point
Summary statistics related to proteome-wise predictions
Protein with the lowest isoelectric point:
>tr|A0A060QSY2|A0A060QSY2_9CAUD Phage antirepressor protein OS=Streptococcus phage DCC1738 OX=1448273 PE=4 SV=1
MM1 pKa = 8.39LMFNYY6 pKa = 10.01DD7 pKa = 3.94RR8 pKa = 11.84DD9 pKa = 3.49IMQPPEE15 pKa = 3.98EE16 pKa = 4.61RR17 pKa = 11.84EE18 pKa = 4.03EE19 pKa = 4.62LDD21 pKa = 3.41PADD24 pKa = 4.33WIFSAGQWIYY34 pKa = 11.59VGDD37 pKa = 4.05CC38 pKa = 3.39
MM1 pKa = 8.39LMFNYY6 pKa = 10.01DD7 pKa = 3.94RR8 pKa = 11.84DD9 pKa = 3.49IMQPPEE15 pKa = 3.98EE16 pKa = 4.61RR17 pKa = 11.84EE18 pKa = 4.03EE19 pKa = 4.62LDD21 pKa = 3.41PADD24 pKa = 4.33WIFSAGQWIYY34 pKa = 11.59VGDD37 pKa = 4.05CC38 pKa = 3.39
Molecular weight: 4.58 kDa
Isoelectric point according different methods:
Protein with the highest isoelectric point:
>tr|A0A060QS92|A0A060QS92_9CAUD Phage protein OS=Streptococcus phage DCC1738 OX=1448273 PE=4 SV=1
MM1 pKa = 6.96QRR3 pKa = 11.84RR4 pKa = 11.84EE5 pKa = 3.9IMNDD9 pKa = 3.93FIKK12 pKa = 10.46EE13 pKa = 3.43IGMAILWMFLGYY25 pKa = 10.88LLGEE29 pKa = 4.21RR30 pKa = 11.84STRR33 pKa = 11.84GGQIRR38 pKa = 3.63
MM1 pKa = 6.96QRR3 pKa = 11.84RR4 pKa = 11.84EE5 pKa = 3.9IMNDD9 pKa = 3.93FIKK12 pKa = 10.46EE13 pKa = 3.43IGMAILWMFLGYY25 pKa = 10.88LLGEE29 pKa = 4.21RR30 pKa = 11.84STRR33 pKa = 11.84GGQIRR38 pKa = 3.63
Molecular weight: 4.53 kDa
Isoelectric point according different methods:
Peptides (in silico digests for buttom-up proteomics)
Below you can find in silico digests of the whole proteome with Trypsin, Chymotrypsin, Trypsin+LysC, LysN, ArgC proteases suitable for different mass spec machines.| Try ESI |
 |
|---|
| ChTry ESI |
|
|---|
| ArgC ESI |
|
|---|
| LysN ESI |
|
|---|
| TryLysC ESI |
|
|---|
| Try MALDI |
|
|---|
| ChTry MALDI |
|
|---|
| ArgC MALDI |
|
|---|
| LysN MALDI |
|
|---|
| TryLysC MALDI |
|
|---|
| Try LTQ |
|
|---|
| ChTry LTQ |
|
|---|
| ArgC LTQ |
|
|---|
| LysN LTQ |
|
|---|
| TryLysC LTQ |
|
|---|
| Try MSlow |
|
|---|
| ChTry MSlow |
|
|---|
| ArgC MSlow |
|
|---|
| LysN MSlow |
|
|---|
| TryLysC MSlow |
|
|---|
| Try MShigh |
|
|---|
| ChTry MShigh |
|
|---|
| ArgC MShigh |
|
|---|
| LysN MShigh |
|
|---|
| TryLysC MShigh |
|
|---|
General Statistics
Number of major isoforms |
Number of additional isoforms |
Number of all proteins |
Number of amino acids |
Min. Seq. Length |
Max. Seq. Length |
Avg. Seq. Length |
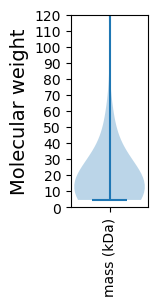
Avg. Mol. Weight |
|---|---|---|---|---|---|---|---|
0 |
11034 |
38 |
2130 |
197.0 |
22.33 |
Amino acid frequency
Ala |
Cys |
Asp |
Glu |
Phe |
Gly |
His |
Ile |
Lys |
Leu |
|---|---|---|---|---|---|---|---|---|---|
7.033 ± 0.703 | 0.598 ± 0.105 |
6.272 ± 0.324 | 8.347 ± 0.712 |
4.069 ± 0.298 | 6.543 ± 0.705 |
1.296 ± 0.186 | 6.38 ± 0.268 |
8.637 ± 0.437 | 8.32 ± 0.275 |
Met |
Asn |
Gln |
Pro |
Arg |
Ser |
Thr |
Val |
Trp |
Tyr |
|---|---|---|---|---|---|---|---|---|---|
2.556 ± 0.302 | 5.057 ± 0.294 |
2.529 ± 0.249 | 4.541 ± 0.296 |
4.586 ± 0.378 | 6.154 ± 0.47 |
5.773 ± 0.485 | 6.426 ± 0.26 |
1.314 ± 0.143 | 3.571 ± 0.355 |
Most of the basic statistics you can see at this page can be downloaded from this CSV file
See this proteome in:

Proteome-pI is available under Creative Commons Attribution-NoDerivs license, for more details see here
| Reference: Kozlowski LP. Proteome-pI 2.0: Proteome Isoelectric Point Database Update. Nucleic Acids Res. 2021, doi: 10.1093/nar/gkab944 | Contact: Lukasz P. Kozlowski |