Bacillus phage vB_BtS_BMBtp15
Taxonomy: Viruses; Duplodnaviria; Heunggongvirae; Uroviricota; Caudoviricetes; Caudovirales; Siphoviridae; unclassified Siphoviridae
Average proteome isoelectric point is 6.35
Get precalculated fractions of proteins
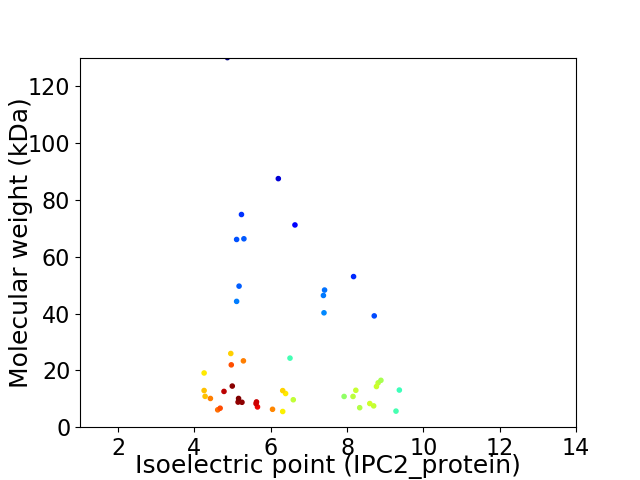
Virtual 2D-PAGE plot for 47 proteins (isoelectric point calculated using IPC2_protein)
Get csv file with sequences according to given criteria:
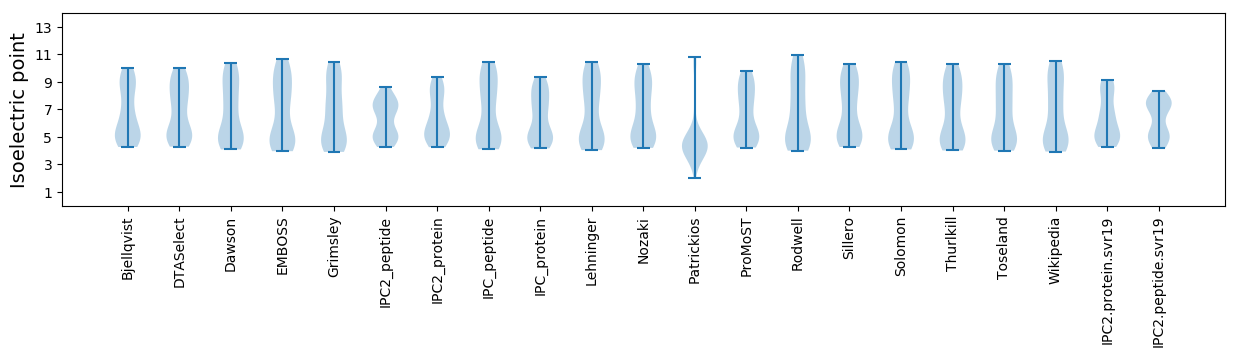
* You can choose from 21 different methods for calculating isoelectric point
Summary statistics related to proteome-wise predictions
Protein with the lowest isoelectric point:
>tr|A0A1B1P7M0|A0A1B1P7M0_9CAUD Integrase OS=Bacillus phage vB_BtS_BMBtp15 OX=1868827 GN=BMBtpLA4_1 PE=4 SV=1
MM1 pKa = 7.33NKK3 pKa = 9.44VADD6 pKa = 3.95HH7 pKa = 7.19PIEE10 pKa = 4.99DD11 pKa = 4.46FYY13 pKa = 11.76GDD15 pKa = 4.34EE16 pKa = 4.12ILSGEE21 pKa = 4.27TYY23 pKa = 10.5FIFGEE28 pKa = 4.23HH29 pKa = 5.76VVLEE33 pKa = 4.54EE34 pKa = 3.83NLKK37 pKa = 10.86LYY39 pKa = 10.39LIQHH43 pKa = 5.6QNVEE47 pKa = 4.33CFRR50 pKa = 11.84AVV52 pKa = 2.85
MM1 pKa = 7.33NKK3 pKa = 9.44VADD6 pKa = 3.95HH7 pKa = 7.19PIEE10 pKa = 4.99DD11 pKa = 4.46FYY13 pKa = 11.76GDD15 pKa = 4.34EE16 pKa = 4.12ILSGEE21 pKa = 4.27TYY23 pKa = 10.5FIFGEE28 pKa = 4.23HH29 pKa = 5.76VVLEE33 pKa = 4.54EE34 pKa = 3.83NLKK37 pKa = 10.86LYY39 pKa = 10.39LIQHH43 pKa = 5.6QNVEE47 pKa = 4.33CFRR50 pKa = 11.84AVV52 pKa = 2.85
Molecular weight: 6.11 kDa
Isoelectric point according different methods:
Protein with the highest isoelectric point:
>tr|A0A1B1P7M4|A0A1B1P7M4_9CAUD Uncharacterized protein OS=Bacillus phage vB_BtS_BMBtp15 OX=1868827 GN=BMBtpLA4_16 PE=4 SV=1
MM1 pKa = 7.39NGVLSASKK9 pKa = 10.42LMKK12 pKa = 10.2ASQVRR17 pKa = 11.84KK18 pKa = 9.39QCAEE22 pKa = 3.74MRR24 pKa = 11.84NNPALLLAMEE34 pKa = 5.05LEE36 pKa = 4.72VKK38 pKa = 10.63RR39 pKa = 11.84NIYY42 pKa = 9.56EE43 pKa = 3.97INRR46 pKa = 11.84KK47 pKa = 9.19VSSS50 pKa = 3.45
MM1 pKa = 7.39NGVLSASKK9 pKa = 10.42LMKK12 pKa = 10.2ASQVRR17 pKa = 11.84KK18 pKa = 9.39QCAEE22 pKa = 3.74MRR24 pKa = 11.84NNPALLLAMEE34 pKa = 5.05LEE36 pKa = 4.72VKK38 pKa = 10.63RR39 pKa = 11.84NIYY42 pKa = 9.56EE43 pKa = 3.97INRR46 pKa = 11.84KK47 pKa = 9.19VSSS50 pKa = 3.45
Molecular weight: 5.66 kDa
Isoelectric point according different methods:
Peptides (in silico digests for buttom-up proteomics)
Below you can find in silico digests of the whole proteome with Trypsin, Chymotrypsin, Trypsin+LysC, LysN, ArgC proteases suitable for different mass spec machines.| Try ESI |
 |
|---|
| ChTry ESI |
|
|---|
| ArgC ESI |
|
|---|
| LysN ESI |
|
|---|
| TryLysC ESI |
|
|---|
| Try MALDI |
|
|---|
| ChTry MALDI |
|
|---|
| ArgC MALDI |
|
|---|
| LysN MALDI |
|
|---|
| TryLysC MALDI |
|
|---|
| Try LTQ |
|
|---|
| ChTry LTQ |
|
|---|
| ArgC LTQ |
|
|---|
| LysN LTQ |
|
|---|
| TryLysC LTQ |
|
|---|
| Try MSlow |
|
|---|
| ChTry MSlow |
|
|---|
| ArgC MSlow |
|
|---|
| LysN MSlow |
|
|---|
| TryLysC MSlow |
|
|---|
| Try MShigh |
|
|---|
| ChTry MShigh |
|
|---|
| ArgC MShigh |
|
|---|
| LysN MShigh |
|
|---|
| TryLysC MShigh |
|
|---|
General Statistics
Number of major isoforms |
Number of additional isoforms |
Number of all proteins |
Number of amino acids |
Min. Seq. Length |
Max. Seq. Length |
Avg. Seq. Length |
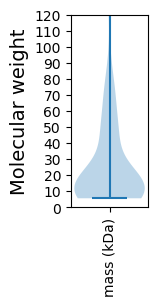
Avg. Mol. Weight |
|---|---|---|---|---|---|---|---|
0 |
10714 |
45 |
1173 |
228.0 |
26.1 |
Amino acid frequency
Ala |
Cys |
Asp |
Glu |
Phe |
Gly |
His |
Ile |
Lys |
Leu |
|---|---|---|---|---|---|---|---|---|---|
6.132 ± 0.469 | 0.859 ± 0.176 |
6.31 ± 0.282 | 8.68 ± 0.461 |
4.013 ± 0.201 | 5.955 ± 0.289 |
1.727 ± 0.184 | 7.271 ± 0.284 |
9.455 ± 0.341 | 7.812 ± 0.355 |
Met |
Asn |
Gln |
Pro |
Arg |
Ser |
Thr |
Val |
Trp |
Tyr |
|---|---|---|---|---|---|---|---|---|---|
2.604 ± 0.229 | 5.628 ± 0.18 |
3.099 ± 0.224 | 3.715 ± 0.31 |
4.06 ± 0.288 | 5.236 ± 0.266 |
5.413 ± 0.233 | 6.394 ± 0.241 |
1.4 ± 0.211 | 4.237 ± 0.327 |
Most of the basic statistics you can see at this page can be downloaded from this CSV file
See this proteome in:

Proteome-pI is available under Creative Commons Attribution-NoDerivs license, for more details see here
| Reference: Kozlowski LP. Proteome-pI 2.0: Proteome Isoelectric Point Database Update. Nucleic Acids Res. 2021, doi: 10.1093/nar/gkab944 | Contact: Lukasz P. Kozlowski |