Sulfolobus turreted icosahedral virus 1
Taxonomy: Viruses; Varidnaviria; Bamfordvirae; Preplasmiviricota; Tectiliviricetes; Belfryvirales; Turriviridae; Alphaturrivirus
Average proteome isoelectric point is 6.61
Get precalculated fractions of proteins
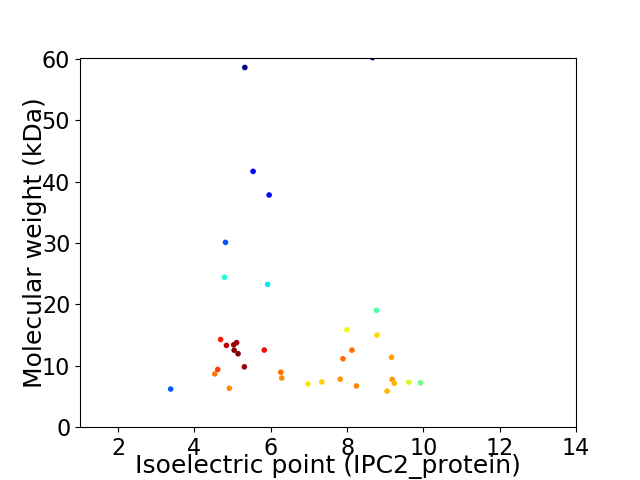
Virtual 2D-PAGE plot for 36 proteins (isoelectric point calculated using IPC2_protein)
Get csv file with sequences according to given criteria:
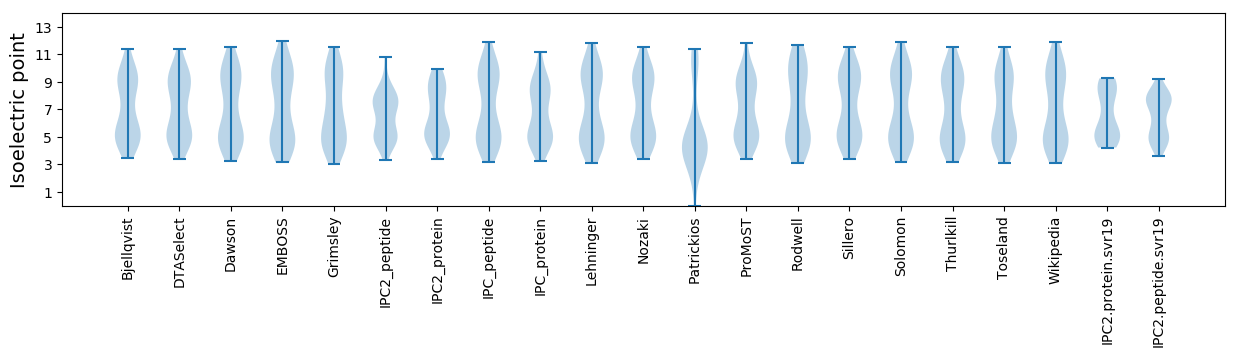
* You can choose from 21 different methods for calculating isoelectric point
Summary statistics related to proteome-wise predictions
Protein with the lowest isoelectric point:
>tr|Q6Q0K9|Q6Q0K9_9VIRU Uncharacterized protein OS=Sulfolobus turreted icosahedral virus 1 OX=269145 GN=B116 PE=1 SV=1
MM1 pKa = 7.26KK2 pKa = 10.52VEE4 pKa = 4.21EE5 pKa = 4.44DD6 pKa = 3.33WEE8 pKa = 4.33EE9 pKa = 3.68VDD11 pKa = 4.73EE12 pKa = 4.96IEE14 pKa = 5.06EE15 pKa = 4.19EE16 pKa = 3.97VDD18 pKa = 4.11EE19 pKa = 4.48ICSRR23 pKa = 11.84VTCEE27 pKa = 3.88DD28 pKa = 3.93CVAEE32 pKa = 4.12ICGDD36 pKa = 3.45LCEE39 pKa = 4.44ILCEE43 pKa = 4.05EE44 pKa = 4.55EE45 pKa = 3.65QDD47 pKa = 4.18LMEE50 pKa = 4.43EE51 pKa = 4.44VEE53 pKa = 4.17
MM1 pKa = 7.26KK2 pKa = 10.52VEE4 pKa = 4.21EE5 pKa = 4.44DD6 pKa = 3.33WEE8 pKa = 4.33EE9 pKa = 3.68VDD11 pKa = 4.73EE12 pKa = 4.96IEE14 pKa = 5.06EE15 pKa = 4.19EE16 pKa = 3.97VDD18 pKa = 4.11EE19 pKa = 4.48ICSRR23 pKa = 11.84VTCEE27 pKa = 3.88DD28 pKa = 3.93CVAEE32 pKa = 4.12ICGDD36 pKa = 3.45LCEE39 pKa = 4.44ILCEE43 pKa = 4.05EE44 pKa = 4.55EE45 pKa = 3.65QDD47 pKa = 4.18LMEE50 pKa = 4.43EE51 pKa = 4.44VEE53 pKa = 4.17
Molecular weight: 6.22 kDa
Isoelectric point according different methods:
Protein with the highest isoelectric point:
>tr|Q6Q0J9|Q6Q0J9_9VIRU Uncharacterized protein OS=Sulfolobus turreted icosahedral virus 1 OX=269145 GN=F93 PE=1 SV=1
MM1 pKa = 7.54PFSVRR6 pKa = 11.84NKK8 pKa = 8.28TFPSGASSSLSILSSINEE26 pKa = 4.27SIKK29 pKa = 10.87GYY31 pKa = 7.43NTPSEE36 pKa = 4.12MSISNLFNISLLSRR50 pKa = 11.84FFSSLLPFITNTFRR64 pKa = 11.84IMM66 pKa = 3.57
MM1 pKa = 7.54PFSVRR6 pKa = 11.84NKK8 pKa = 8.28TFPSGASSSLSILSSINEE26 pKa = 4.27SIKK29 pKa = 10.87GYY31 pKa = 7.43NTPSEE36 pKa = 4.12MSISNLFNISLLSRR50 pKa = 11.84FFSSLLPFITNTFRR64 pKa = 11.84IMM66 pKa = 3.57
Molecular weight: 7.33 kDa
Isoelectric point according different methods:
Peptides (in silico digests for buttom-up proteomics)
Below you can find in silico digests of the whole proteome with Trypsin, Chymotrypsin, Trypsin+LysC, LysN, ArgC proteases suitable for different mass spec machines.| Try ESI |
 |
|---|
| ChTry ESI |
|
|---|
| ArgC ESI |
|
|---|
| LysN ESI |
|
|---|
| TryLysC ESI |
|
|---|
| Try MALDI |
|
|---|
| ChTry MALDI |
|
|---|
| ArgC MALDI |
|
|---|
| LysN MALDI |
|
|---|
| TryLysC MALDI |
|
|---|
| Try LTQ |
|
|---|
| ChTry LTQ |
|
|---|
| ArgC LTQ |
|
|---|
| LysN LTQ |
|
|---|
| TryLysC LTQ |
|
|---|
| Try MSlow |
|
|---|
| ChTry MSlow |
|
|---|
| ArgC MSlow |
|
|---|
| LysN MSlow |
|
|---|
| TryLysC MSlow |
|
|---|
| Try MShigh |
|
|---|
| ChTry MShigh |
|
|---|
| ArgC MShigh |
|
|---|
| LysN MShigh |
|
|---|
| TryLysC MShigh |
|
|---|
General Statistics
Number of major isoforms |
Number of additional isoforms |
Number of all proteins |
Number of amino acids |
Min. Seq. Length |
Max. Seq. Length |
Avg. Seq. Length |
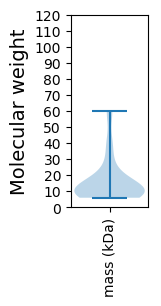
Avg. Mol. Weight |
|---|---|---|---|---|---|---|---|
0 |
5062 |
51 |
557 |
140.6 |
15.97 |
Amino acid frequency
Ala |
Cys |
Asp |
Glu |
Phe |
Gly |
His |
Ile |
Lys |
Leu |
|---|---|---|---|---|---|---|---|---|---|
5.709 ± 0.578 | 0.77 ± 0.246 |
4.03 ± 0.294 | 9.305 ± 0.919 |
4.07 ± 0.357 | 6.025 ± 0.536 |
1.6 ± 0.259 | 9.008 ± 0.5 |
8.514 ± 0.909 | 10.016 ± 0.393 |
Met |
Asn |
Gln |
Pro |
Arg |
Ser |
Thr |
Val |
Trp |
Tyr |
|---|---|---|---|---|---|---|---|---|---|
1.995 ± 0.251 | 4.82 ± 0.288 |
3.872 ± 0.641 | 4.089 ± 0.327 |
3.991 ± 0.417 | 6.717 ± 0.53 |
4.721 ± 0.434 | 5.946 ± 0.348 |
0.751 ± 0.168 | 4.05 ± 0.447 |
Most of the basic statistics you can see at this page can be downloaded from this CSV file
See this proteome in:

Proteome-pI is available under Creative Commons Attribution-NoDerivs license, for more details see here
| Reference: Kozlowski LP. Proteome-pI 2.0: Proteome Isoelectric Point Database Update. Nucleic Acids Res. 2021, doi: 10.1093/nar/gkab944 | Contact: Lukasz P. Kozlowski |