Bartonella sp. JB15
Taxonomy: cellular organisms; Bacteria; Proteobacteria; Alphaproteobacteria; Hyphomicrobiales; Bartonellaceae; Bartonella; unclassified Bartonella
Average proteome isoelectric point is 7.15
Get precalculated fractions of proteins
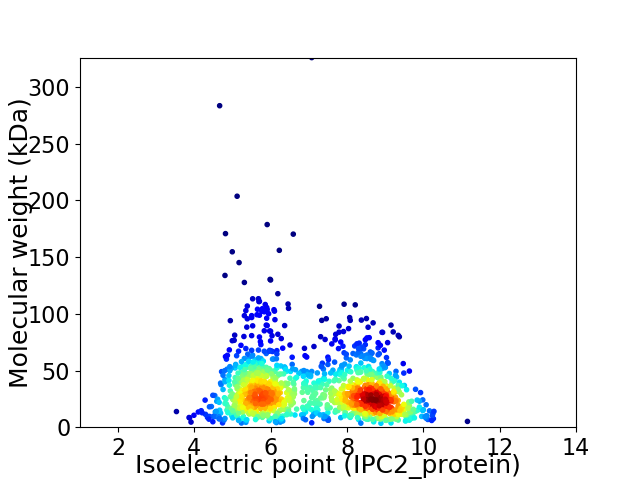
Virtual 2D-PAGE plot for 1265 proteins (isoelectric point calculated using IPC2_protein)
Get csv file with sequences according to given criteria:
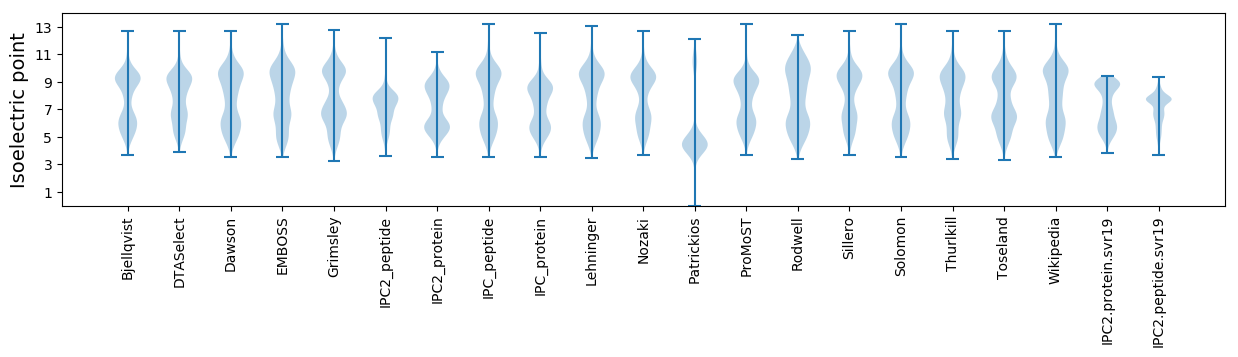
* You can choose from 21 different methods for calculating isoelectric point
Summary statistics related to proteome-wise predictions
Protein with the lowest isoelectric point:
>tr|A0A1S6XHL2|A0A1S6XHL2_9RHIZ Cysteine desulfurase OS=Bartonella sp. JB15 OX=1933906 GN=BJB15x_006260 PE=4 SV=1
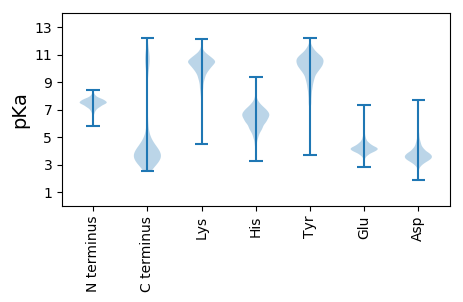
MM1 pKa = 7.19GLIYY5 pKa = 10.4RR6 pKa = 11.84IDD8 pKa = 3.68IEE10 pKa = 4.46DD11 pKa = 3.88DD12 pKa = 3.55RR13 pKa = 11.84SVKK16 pKa = 10.15IEE18 pKa = 3.94MTLTAPGCPVAGEE31 pKa = 3.96MPGWVEE37 pKa = 3.87NAVSAVEE44 pKa = 4.32GVLSVEE50 pKa = 4.67VIMTFDD56 pKa = 4.04PPWTPEE62 pKa = 4.01CMSEE66 pKa = 3.94EE67 pKa = 4.01AQITVGWYY75 pKa = 9.64
MM1 pKa = 7.19GLIYY5 pKa = 10.4RR6 pKa = 11.84IDD8 pKa = 3.68IEE10 pKa = 4.46DD11 pKa = 3.88DD12 pKa = 3.55RR13 pKa = 11.84SVKK16 pKa = 10.15IEE18 pKa = 3.94MTLTAPGCPVAGEE31 pKa = 3.96MPGWVEE37 pKa = 3.87NAVSAVEE44 pKa = 4.32GVLSVEE50 pKa = 4.67VIMTFDD56 pKa = 4.04PPWTPEE62 pKa = 4.01CMSEE66 pKa = 3.94EE67 pKa = 4.01AQITVGWYY75 pKa = 9.64
Molecular weight: 8.26 kDa
Isoelectric point according different methods:
Protein with the highest isoelectric point:
>tr|A0A1S6XGA1|A0A1S6XGA1_9RHIZ Apolipoprotein N-acyltransferase OS=Bartonella sp. JB15 OX=1933906 GN=BJB15x_000350 PE=3 SV=1
MM1 pKa = 7.35KK2 pKa = 9.43RR3 pKa = 11.84TYY5 pKa = 10.27QPSKK9 pKa = 9.73LVRR12 pKa = 11.84KK13 pKa = 9.15RR14 pKa = 11.84RR15 pKa = 11.84HH16 pKa = 4.42GFRR19 pKa = 11.84ARR21 pKa = 11.84MATAGGRR28 pKa = 11.84KK29 pKa = 9.15VIAARR34 pKa = 11.84RR35 pKa = 11.84ARR37 pKa = 11.84GRR39 pKa = 11.84KK40 pKa = 9.03RR41 pKa = 11.84LSAA44 pKa = 4.03
MM1 pKa = 7.35KK2 pKa = 9.43RR3 pKa = 11.84TYY5 pKa = 10.27QPSKK9 pKa = 9.73LVRR12 pKa = 11.84KK13 pKa = 9.15RR14 pKa = 11.84RR15 pKa = 11.84HH16 pKa = 4.42GFRR19 pKa = 11.84ARR21 pKa = 11.84MATAGGRR28 pKa = 11.84KK29 pKa = 9.15VIAARR34 pKa = 11.84RR35 pKa = 11.84ARR37 pKa = 11.84GRR39 pKa = 11.84KK40 pKa = 9.03RR41 pKa = 11.84LSAA44 pKa = 4.03
Molecular weight: 5.11 kDa
Isoelectric point according different methods:
Peptides (in silico digests for buttom-up proteomics)
Below you can find in silico digests of the whole proteome with Trypsin, Chymotrypsin, Trypsin+LysC, LysN, ArgC proteases suitable for different mass spec machines.| Try ESI |
 |
|---|
| ChTry ESI |
|
|---|
| ArgC ESI |
|
|---|
| LysN ESI |
|
|---|
| TryLysC ESI |
|
|---|
| Try MALDI |
|
|---|
| ChTry MALDI |
|
|---|
| ArgC MALDI |
|
|---|
| LysN MALDI |
|
|---|
| TryLysC MALDI |
|
|---|
| Try LTQ |
|
|---|
| ChTry LTQ |
|
|---|
| ArgC LTQ |
|
|---|
| LysN LTQ |
|
|---|
| TryLysC LTQ |
|
|---|
| Try MSlow |
|
|---|
| ChTry MSlow |
|
|---|
| ArgC MSlow |
|
|---|
| LysN MSlow |
|
|---|
| TryLysC MSlow |
|
|---|
| Try MShigh |
|
|---|
| ChTry MShigh |
|
|---|
| ArgC MShigh |
|
|---|
| LysN MShigh |
|
|---|
| TryLysC MShigh |
|
|---|
General Statistics
Number of major isoforms |
Number of additional isoforms |
Number of all proteins |
Number of amino acids |
Min. Seq. Length |
Max. Seq. Length |
Avg. Seq. Length |
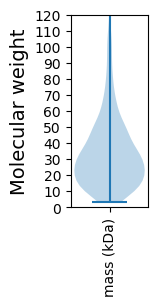
Avg. Mol. Weight |
|---|---|---|---|---|---|---|---|
0 |
402163 |
30 |
2841 |
317.9 |
35.56 |
Amino acid frequency
Ala |
Cys |
Asp |
Glu |
Phe |
Gly |
His |
Ile |
Lys |
Leu |
|---|---|---|---|---|---|---|---|---|---|
7.723 ± 0.07 | 1.067 ± 0.027 |
5.022 ± 0.05 | 6.052 ± 0.074 |
4.565 ± 0.054 | 6.654 ± 0.08 |
2.261 ± 0.033 | 8.473 ± 0.077 |
6.354 ± 0.069 | 9.882 ± 0.08 |
Met |
Asn |
Gln |
Pro |
Arg |
Ser |
Thr |
Val |
Trp |
Tyr |
|---|---|---|---|---|---|---|---|---|---|
2.454 ± 0.037 | 4.734 ± 0.069 |
3.72 ± 0.047 | 3.913 ± 0.047 |
5.108 ± 0.059 | 6.613 ± 0.063 |
5.252 ± 0.048 | 6.249 ± 0.06 |
0.999 ± 0.027 | 2.905 ± 0.039 |
Most of the basic statistics you can see at this page can be downloaded from this CSV file
See this proteome in:

Proteome-pI is available under Creative Commons Attribution-NoDerivs license, for more details see here
| Reference: Kozlowski LP. Proteome-pI 2.0: Proteome Isoelectric Point Database Update. Nucleic Acids Res. 2021, doi: 10.1093/nar/gkab944 | Contact: Lukasz P. Kozlowski |