bacterium HR16
Taxonomy: cellular organisms; Bacteria; unclassified Bacteria
Average proteome isoelectric point is 6.64
Get precalculated fractions of proteins
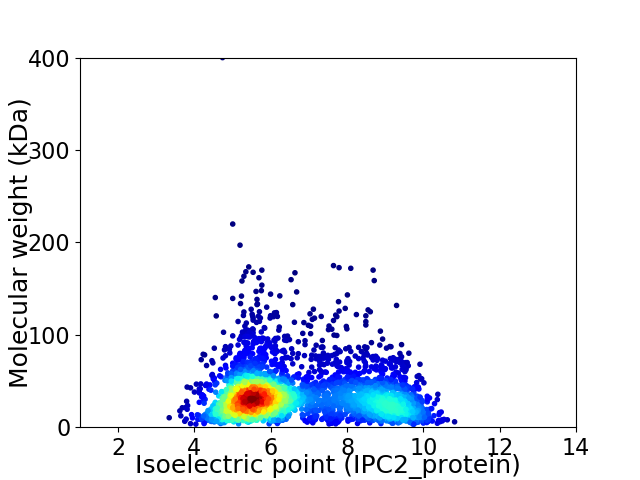
Virtual 2D-PAGE plot for 3294 proteins (isoelectric point calculated using IPC2_protein)
Get csv file with sequences according to given criteria:
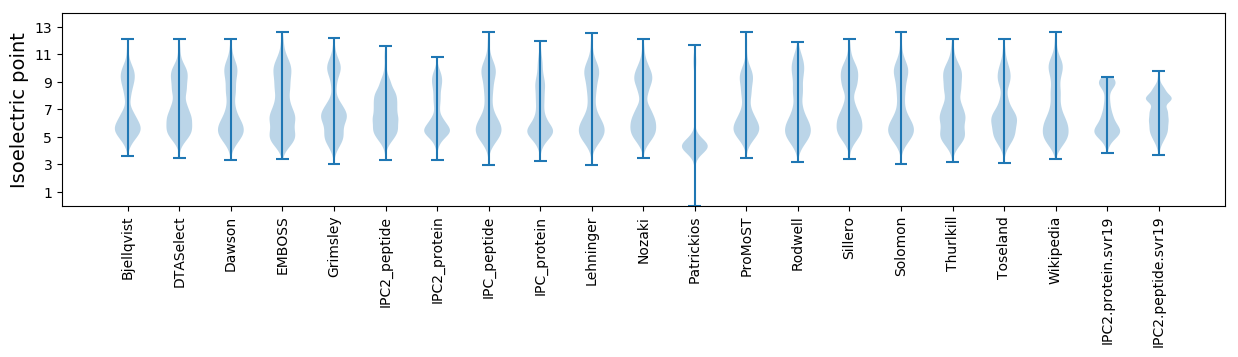
* You can choose from 21 different methods for calculating isoelectric point
Summary statistics related to proteome-wise predictions
Protein with the lowest isoelectric point:
>tr|A0A2H5X5P5|A0A2H5X5P5_9BACT Uncharacterized protein OS=bacterium HR16 OX=2035411 GN=HRbin16_02315 PE=4 SV=1
MM1 pKa = 7.36WAFFAYY7 pKa = 10.46LIAATAFYY15 pKa = 9.56TILVMIAQPDD25 pKa = 4.35PYY27 pKa = 10.93DD28 pKa = 3.89SEE30 pKa = 4.26AWEE33 pKa = 4.3MPDD36 pKa = 5.38DD37 pKa = 4.13VEE39 pKa = 5.53LPIPTAEE46 pKa = 4.35EE47 pKa = 3.73EE48 pKa = 4.31VEE50 pKa = 4.49TYY52 pKa = 10.53RR53 pKa = 11.84KK54 pKa = 9.65AAA56 pKa = 3.7
MM1 pKa = 7.36WAFFAYY7 pKa = 10.46LIAATAFYY15 pKa = 9.56TILVMIAQPDD25 pKa = 4.35PYY27 pKa = 10.93DD28 pKa = 3.89SEE30 pKa = 4.26AWEE33 pKa = 4.3MPDD36 pKa = 5.38DD37 pKa = 4.13VEE39 pKa = 5.53LPIPTAEE46 pKa = 4.35EE47 pKa = 3.73EE48 pKa = 4.31VEE50 pKa = 4.49TYY52 pKa = 10.53RR53 pKa = 11.84KK54 pKa = 9.65AAA56 pKa = 3.7
Molecular weight: 6.43 kDa
Isoelectric point according different methods:
Protein with the highest isoelectric point:
>tr|A0A2H5X7P2|A0A2H5X7P2_9BACT NTP_transf_2 domain-containing protein OS=bacterium HR16 OX=2035411 GN=HRbin16_02947 PE=4 SV=1
MM1 pKa = 7.44NGQPRR6 pKa = 11.84VIVFSTPNCPYY17 pKa = 10.66CNMAKK22 pKa = 10.18RR23 pKa = 11.84YY24 pKa = 9.21LRR26 pKa = 11.84EE27 pKa = 3.45RR28 pKa = 11.84GIRR31 pKa = 11.84FRR33 pKa = 11.84DD34 pKa = 3.19VDD36 pKa = 3.75VSRR39 pKa = 11.84DD40 pKa = 3.24PAAARR45 pKa = 11.84DD46 pKa = 3.67MVRR49 pKa = 11.84RR50 pKa = 11.84SGQQGVPVIDD60 pKa = 3.52INGKK64 pKa = 9.22IVVGFDD70 pKa = 2.95RR71 pKa = 11.84AKK73 pKa = 10.36INQLLGLKK81 pKa = 9.88
MM1 pKa = 7.44NGQPRR6 pKa = 11.84VIVFSTPNCPYY17 pKa = 10.66CNMAKK22 pKa = 10.18RR23 pKa = 11.84YY24 pKa = 9.21LRR26 pKa = 11.84EE27 pKa = 3.45RR28 pKa = 11.84GIRR31 pKa = 11.84FRR33 pKa = 11.84DD34 pKa = 3.19VDD36 pKa = 3.75VSRR39 pKa = 11.84DD40 pKa = 3.24PAAARR45 pKa = 11.84DD46 pKa = 3.67MVRR49 pKa = 11.84RR50 pKa = 11.84SGQQGVPVIDD60 pKa = 3.52INGKK64 pKa = 9.22IVVGFDD70 pKa = 2.95RR71 pKa = 11.84AKK73 pKa = 10.36INQLLGLKK81 pKa = 9.88
Molecular weight: 9.15 kDa
Isoelectric point according different methods:
Peptides (in silico digests for buttom-up proteomics)
Below you can find in silico digests of the whole proteome with Trypsin, Chymotrypsin, Trypsin+LysC, LysN, ArgC proteases suitable for different mass spec machines.| Try ESI |
 |
|---|
| ChTry ESI |
|
|---|
| ArgC ESI |
|
|---|
| LysN ESI |
|
|---|
| TryLysC ESI |
|
|---|
| Try MALDI |
|
|---|
| ChTry MALDI |
|
|---|
| ArgC MALDI |
|
|---|
| LysN MALDI |
|
|---|
| TryLysC MALDI |
|
|---|
| Try LTQ |
|
|---|
| ChTry LTQ |
|
|---|
| ArgC LTQ |
|
|---|
| LysN LTQ |
|
|---|
| TryLysC LTQ |
|
|---|
| Try MSlow |
|
|---|
| ChTry MSlow |
|
|---|
| ArgC MSlow |
|
|---|
| LysN MSlow |
|
|---|
| TryLysC MSlow |
|
|---|
| Try MShigh |
|
|---|
| ChTry MShigh |
|
|---|
| ArgC MShigh |
|
|---|
| LysN MShigh |
|
|---|
| TryLysC MShigh |
|
|---|
General Statistics
Number of major isoforms |
Number of additional isoforms |
Number of all proteins |
Number of amino acids |
Min. Seq. Length |
Max. Seq. Length |
Avg. Seq. Length |
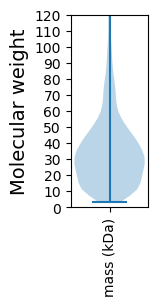
Avg. Mol. Weight |
|---|---|---|---|---|---|---|---|
0 |
1088270 |
29 |
3688 |
330.4 |
36.82 |
Amino acid frequency
Ala |
Cys |
Asp |
Glu |
Phe |
Gly |
His |
Ile |
Lys |
Leu |
|---|---|---|---|---|---|---|---|---|---|
9.529 ± 0.046 | 1.059 ± 0.017 |
4.785 ± 0.026 | 6.617 ± 0.059 |
3.559 ± 0.026 | 7.751 ± 0.048 |
2.307 ± 0.026 | 5.004 ± 0.031 |
3.166 ± 0.034 | 10.154 ± 0.047 |
Met |
Asn |
Gln |
Pro |
Arg |
Ser |
Thr |
Val |
Trp |
Tyr |
|---|---|---|---|---|---|---|---|---|---|
2.33 ± 0.021 | 2.82 ± 0.029 |
5.487 ± 0.031 | 4.242 ± 0.03 |
7.615 ± 0.041 | 4.968 ± 0.032 |
5.299 ± 0.038 | 8.324 ± 0.041 |
1.886 ± 0.026 | 3.1 ± 0.025 |
Most of the basic statistics you can see at this page can be downloaded from this CSV file
See this proteome in:

Proteome-pI is available under Creative Commons Attribution-NoDerivs license, for more details see here
| Reference: Kozlowski LP. Proteome-pI 2.0: Proteome Isoelectric Point Database Update. Nucleic Acids Res. 2021, doi: 10.1093/nar/gkab944 | Contact: Lukasz P. Kozlowski |